Picture this: your paid social team sends over the monthly Meta Ads report. Reach is up thirty percent. Impressions look strong. The engagement rate is the best it has been all quarter. There is a slide full of green arrows and everyone in the room nods approvingly.
Then someone asks: did revenue actually go up? And the room goes quiet.
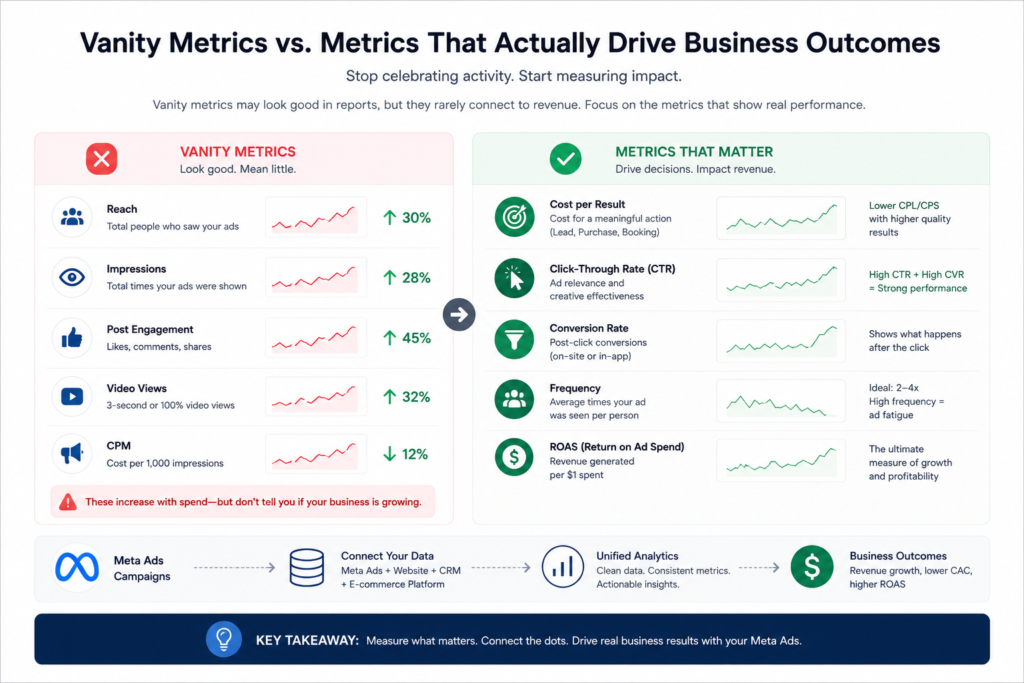
This is a scene playing out in marketing meetings across Singapore every month. Meta Ads Manager is genuinely good at making campaigns look productive. The metrics it surfaces by default — reach, impressions, page likes, video views — are easy to generate and easy to report. They are also, for most businesses, almost entirely disconnected from what actually matters.
Moving beyond vanity metrics is not about being cynical about Meta as a platform. It remains one of the most powerful paid channels available to businesses in Singapore, particularly for consumer brands, eCommerce, and B2C services. The problem is not the platform. The problem is the layer of measurement sitting on top of it.
This article covers what that better measurement layer looks like — which metrics to track, how to read them honestly, and how to connect Meta Ads data to the business outcomes it is supposed to drive. It draws on the approach used by the team at Engine Analytics, a data analytics company in Singapore that specialises in connecting marketing data to business outcomes.
Vanity metrics are numbers that look positive by default. They tend to increase whenever you spend more money, and they tell you almost nothing about whether that spend is working.
Meta’s default reporting view is built around them. When you open Ads Manager without customising your columns, you see reach, impressions, CPM, post engagement, and sometimes video views. These are the metrics Meta chooses to surface prominently.
There is a structural reason for this. Reach and impressions always go up when you increase budget. That makes the platform look effective regardless of what is actually happening on your website or in your pipeline. Meta has a commercial interest in presenting its platform well, and vanity metrics serve that interest.
That is not a conspiracy — it is simply how the default reporting is built. Your job as an advertiser is to look past it.
The shift from vanity to meaningful analytics starts with a straightforward question: what does this campaign need to produce for the business? Once you have an honest answer to that, you can work backwards to the metrics that indicate whether you are getting there.
The following are the metrics that carry real analytical weight for most businesses running Meta campaigns in Singapore.
“Cost per result” sounds useful but is only meaningful when “result” is defined correctly. A result should always be a business action — a lead form submission, a purchase, an appointment booking — not a click or a video view. If your result is set to reach or engagement, your cost per result metric is measuring nothing useful.
Click-through rate, or CTR, matters but needs context. A high CTR tells you the creative is compelling. It says nothing about what happens after the click. The more useful pairing is CTR alongside your post-click conversion rate. If CTR is strong but conversion rate is low, the problem is on your landing page or in your offer — not your ad.
The gap between cost per link click and cost per landing page view is often overlooked. When these two numbers diverge significantly, it usually means your landing page is loading slowly or failing on mobile. In Singapore, where mobile accounts for the majority of social media usage, a slow mobile experience will silently kill campaigns that look fine in Ads Manager.
Frequency is one of the most underused metrics in Singapore’s Meta advertising landscape. It tells you how many times the average person in your audience has seen your ad. When frequency climbs above four or five without a creative refresh, you are paying to show the same ad to people who have already decided to ignore it. Cost per result deteriorates while spend continues. Monitoring frequency proactively prevents this.
ROAS — return on ad spend — is where the real accountability sits. But like CAC, it is only meaningful when defined consistently. Which revenue figure feeds it? Is it gross revenue, net revenue, or margin? Does it include all conversion windows or only a specific attribution window? Those decisions need to be made explicitly and applied consistently, or you will produce a different ROAS number every time someone runs the report.
Meta’s default attribution setting is a seven-day click window combined with a one-day view-through window. That view-through component is the part most advertisers do not realise is switched on.
View-through attribution means Meta claims credit for a conversion if someone saw your ad — without clicking it — and then converted within twenty-four hours. In a market like Singapore where consumers are constantly exposed to advertising across multiple channels before making a decision, this creates significant overcounting. Meta can claim credit for a purchase that happened because of a Google search, an email, or a direct visit, simply because your ad appeared in the person’s feed that day.
The iOS 14 privacy changes made this worse. Apple’s App Tracking Transparency framework broke the pixel’s ability to track a significant portion of iPhone users — and Singapore has one of the highest iPhone usage rates in Southeast Asia. What Meta reports as conversions is now an extrapolation, not an exact count. Meta is transparent about this in their own documentation, but the implication is not always clear to advertisers reading the numbers.
This does not mean Meta attribution is useless. It means you should never treat it as your only measurement source. Comparing Meta’s reported conversions against your CRM or your eCommerce platform’s order data gives you a cleaner picture of what the channel is actually contributing.
This kind of cross-channel reconciliation is part of what makes building a proper marketing data pipeline so important. When all your data sources connect to a single reporting layer, you can see where Meta’s numbers align with reality and where they are inflated.
This is where the real measurement gap lives for most businesses.
Meta Ads Manager shows you what happened on the platform — clicks, impressions, reported conversions. It does not show you what happened to those leads after they entered your CRM. It does not show you which campaigns produced customers who actually retained. It does not show you the relationship between your ad spend and your margin.
Consider a common scenario. A lead generation campaign produces leads at a cost of fifteen dollars each. Another campaign produces leads at forty dollars each. On the surface, the first campaign looks far more efficient. But when you connect Meta data to your CRM and pull actual close rates, you discover that the fifteen-dollar leads close at four percent while the forty-dollar leads close at twenty-two percent. On a cost-per-customer basis, the expensive campaign is dramatically more efficient.
Without connecting Meta data to downstream CRM data, you would optimise toward the cheaper leads and make your overall results worse.
This is the same pattern we cover in the context of eCommerce data analytics in Singapore — the insight is not in the ad platform data or the sales data. It is in the connection between them.
Businesses serious about this kind of connected reporting also tend to move away from manual media reporting processes toward automated systems that pull from both Meta and their CRM simultaneously, so the full picture is always available without anyone needing to assemble it.
One of the most common ways Meta Ads analytics misleads businesses is through aggregation. An overall campaign ROAS of three-point-two looks reasonable. But when you break it down, you might find one ad set running at nine-x and three others running at point-eight-x. The strong performer is masking three underperformers, and budget is being distributed across all four.
Meaningful Meta analytics requires segmentation at multiple levels.
By campaign objective: awareness, traffic, conversion, and lead generation campaigns should never be aggregated together. Their metrics are not comparable.
By audience type: cold audiences, warm remarketing audiences, and lookalike audiences respond differently and need to be read separately. Blending them produces averages that describe nothing accurately.
By placement: Meta’s Advantage+ placement setting distributes ads across Facebook feed, Instagram feed, Stories, Reels, and the Audience Network. Performance can vary dramatically across these. A creative that works in Stories often fails in the right-column feed, and vice versa.
By creative format: static images, carousels, and video ads attract different types of attention and convert differently. Knowing which format performs by audience and objective is one of the highest-value insights Meta analytics can produce.
In the Singapore context, there is an additional layer worth segmenting: traffic that converts on your own site versus traffic that converts through a marketplace. Shopee and Lazada buyers behave differently from direct-to-site buyers, and campaigns targeting them need to be evaluated against different benchmarks.
A Meta Ads reporting setup that is genuinely useful has a few consistent characteristics.
It updates automatically. A report that someone builds once a week in a spreadsheet is always out of date. Campaign performance can shift significantly within forty-eight hours. A live dashboard connected directly to the Meta Ads API gives you numbers you can act on rather than numbers you look back at.
It connects to at least one external data source. Ideally your CRM, your eCommerce platform, or your analytics layer. Meta’s own numbers, read in isolation, are not enough to make accurate optimisation decisions for the reasons described above.
It is segmented by default, not aggregated. The top-level numbers are a starting point. The dashboard should make it easy to drill into campaign, audience, placement, and creative without exporting anything.
It tracks frequency and spend pacing alongside performance metrics. Frequency alerts prevent you from burning budget on ad fatigue. Spend pacing visibility prevents budget surprises at the end of the month.
If you are still running reports manually in Excel or pulling them ad-hoc from Ads Manager, the piece on replacing manual Excel reporting with modern analytics covers the practical steps involved in making that transition.
At Engine Analytics — a data analytics company in Singapore, we work with marketing teams across Singapore who are running Meta Ads and want to understand what the numbers actually mean. The most common problem we encounter is not a lack of data — it is an abundance of platform data that is not connected to anything.
Our approach is to build the reporting layer that sits between Meta Ads Manager, your CRM, and your revenue data. Through our data analytics services, we connect those sources, apply consistent metric definitions, and surface a live dashboard that shows you what is actually driving conversions and at what cost — without requiring you to touch Ads Manager every time you want an answer.
For teams that want predictable, ongoing analytics support rather than a one-off project, our DAaaS plans are structured around exactly this kind of embedded reporting partnership. You can also review our project case studies to see how this has been implemented for brands running paid social across Singapore and the region.
If your current Meta reporting is producing numbers that look impressive but do not seem to connect to revenue, get in touch and we can walk through what a connected analytics setup would look like for your business.
Meta Ads can be a high-performing channel for businesses in Singapore. The platform reaches a significant portion of the population, offers detailed targeting, and gives marketers genuine creative flexibility. But the default reporting layer is not designed to show you whether your investment is working — it is designed to show you that the platform is active.
Moving beyond vanity metrics means redefining what you measure, connecting your Meta data to downstream revenue sources, and building reporting that gives you accurate, segmented, up-to-date numbers rather than weekly snapshots that someone assembled by hand.
The businesses that get this right do not just make better decisions about their Meta budget. They understand their customers better, they iterate on creative faster, and they avoid the common trap of optimising toward metrics that look good in a report but mean nothing on a balance sheet.
Vanity metrics in Meta Ads include reach, impressions, page likes, and video views. They are called vanity metrics because they tend to increase automatically when you spend more money, regardless of whether that spending is generating any real business value. They are easy to report and look positive by default, but they rarely have a meaningful connection to revenue, customer acquisition, or profit. Businesses that rely on these metrics end up optimising their campaigns toward engagement rather than outcomes, which typically results in higher spend and lower returns over time.
Accurate ROAS measurement from Meta requires three things. First, a clear definition of what revenue figure you are measuring against — gross revenue, net revenue, or margin — agreed by the relevant stakeholders and applied consistently. Second, an attribution window decision that reflects how your customers actually buy, rather than Meta’s default seven-day click plus one-day view setting, which tends to overcount. Third, a cross-reference against your CRM or eCommerce platform’s order data, because Meta’s pixel reporting is less accurate than it was before the iOS 14 privacy changes. When all three are in place, the ROAS figure you produce is one you can actually trust and act on.
Yes. This is one of the most common engagements we work on. We connect Meta Ads Manager data to your CRM, your eCommerce platform, or your billing system using the relevant APIs, apply your agreed metric logic, and build a live reporting dashboard that shows the full picture — not just what Meta reports, but what those campaigns actually produced in terms of customers, revenue, and cost per acquisition. Visit the Engine Analytics contact page to discuss your specific setup and what a connected reporting layer would look like for your business.
