
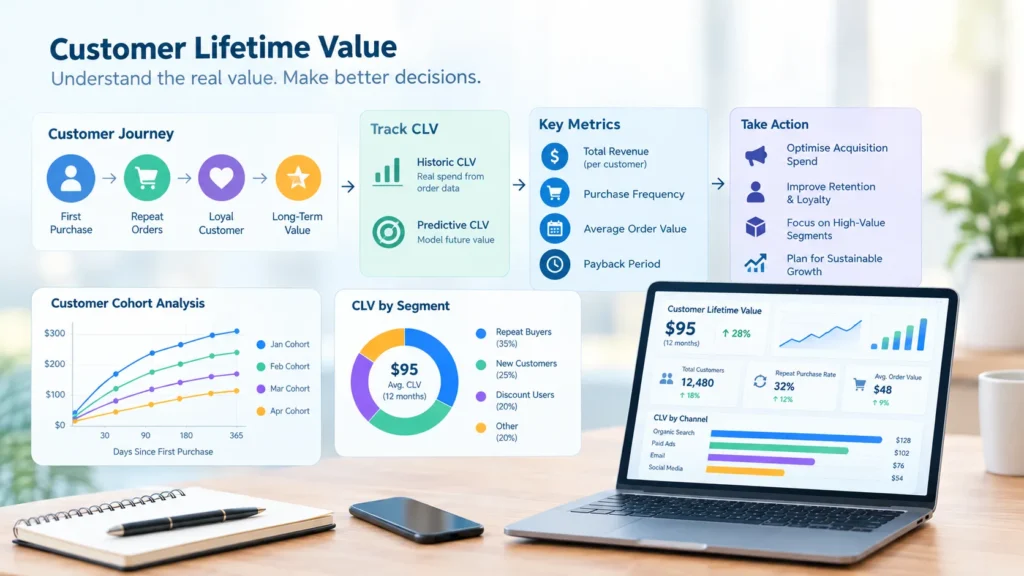
A Singapore pet supplies brand reports a customer lifetime value of S$310 in its investor update. The figure came from a founder’s spreadsheet: average order value, multiplied by an estimated number of orders per year, multiplied by an assumed five-year customer life. Three months later, a new head of growth pulls the actual order data and finds that fewer than a third of customers place a second order, that most repeat purchasing comes from a small group who reorder every six weeks, and that the average customer’s realised value after twelve months is closer to S$95. The S$310 was not dishonest — it was an assumption that had never been checked against behaviour.
In the meantime, acquisition targets had been set against that number and advertising budgets had been scaled on it. The business had been willing to pay up to S$90 to acquire a customer on the belief that each one would return S$310, when the evidence supported a far tighter limit. This is what happens when customer lifetime value is treated as a number to quote rather than a measurement to maintain. This article covers how to track customer lifetime value for ecommerce properly, from your own order data, and what to do with it once you have it. It draws on the approach used by Engine Analytics, a data analytics company in Singapore that builds analytics infrastructure for ecommerce businesses.
Customer lifetime value is the total value a customer generates for the business over the course of the relationship. It exists in two forms that are often confused. Historic CLV is what customers have actually spent to date, and it is a fact drawn from order records. Predictive CLV is an estimate of what customers are likely to spend in future, and it is a model. The familiar formula — average order value, multiplied by purchase frequency, multiplied by expected customer lifespan — is a rough sanity check at best. It assumes every customer behaves like the average, which is rarely true when a small group of loyal buyers drives most of the repeat revenue.
The definition of value matters as much as the formula. CLV calculated on revenue overstates what the customer is worth, because it ignores product cost, shipping, payment fees, and returns. For decision-making, value should be measured after refunds and, where product costs are maintained, as contribution margin. A frequently cited rule of thumb is that lifetime value should be around three times the cost of acquiring the customer, but the ratio hides the question that matters to cash flow — how long it takes to earn the acquisition cost back — so payback period should be tracked alongside it.
Most unreliable CLV figures share the same handful of causes. Customer identity is fragmented, because guest checkouts and changed email addresses turn one person into several, which understates repeat purchasing and overstates the number of new customers. Refunds and returns are ignored, so value is counted that was later handed back. Cohorts are averaged together, blending customers acquired years ago with those acquired last month, so a lifetime figure describes nobody in particular. There is often no time horizon at all, so two people quote “CLV” and mean twelve months and five years. And wholesale or B2B orders sit in the same data as retail, quietly inflating the average.
Each of these is a data problem rather than an analysis problem, which is why CLV cannot be fixed inside a dashboard. It needs a defined customer identity, defined value, and a clean order history underneath it — the same foundation described in our article on building a Shopify and BigQuery analytics stack.
The most reliable approach is cohort-based. Customers are grouped by the month of their first purchase, and the cumulative value per customer is tracked at fixed intervals — thirty, ninety, one hundred and eighty, and three hundred and sixty-five days. Plotted together, the cohort curves show how quickly customers return, how much they spend, and whether newer cohorts behave better or worse than older ones. A single blended average cannot show this. A curve that flattens after ninety days tells a very different story from one that keeps climbing, and the difference should change how the business spends on acquisition and retention.
Doing this well takes five steps. Customer identity is unified using a documented rule. Value is defined after refunds, and after product costs where they are available. The full order history is modelled in the warehouse so that every customer’s orders can be joined to their acquisition source. Cohort curves are produced from that model, then segmented by acquisition channel, first product purchased, discount use, and market. Finally, the definitions are fixed and versioned, so that a CLV quoted in March means the same thing in September. The segmentation is where the insight lives: the customers acquired through one channel can be worth twice as much as those from another, and no blended average will reveal it.
Once enough history exists, predictive models can estimate the future value of each customer. Probabilistic models such as BG/NBD, paired with a spend model, estimate how many more purchases a customer is likely to make and how much they will spend, based on their recency, frequency, and monetary patterns. The same approach can be built with machine learning inside BigQuery. These models need a meaningful amount of repeat-purchase data — typically a year or more of history and a reasonable number of repeat buyers — to be reliable, and they should always be validated by predicting an earlier period and comparing the result with what actually happened.
Predictive CLV is best used to prioritise, not to promise. It can rank customers for retention campaigns and help judge which acquisition channels attract higher-value buyers early. For businesses selling products people buy once or twice in their lifetime, such as furniture or appliances, most of the value sits in the first order, and effort is better spent on average order value and margin than on modelling repeat behaviour that does not exist.
A trusted CLV changes decisions in four places. It sets the ceiling on what the business can pay to acquire a customer, by channel, with a payback window the finance team can support — and it works best alongside the channel view in our framework for attribution modelling. It shapes retention: the median time between first and second orders shows when a follow-up email or offer should land, and the customers most likely to lapse can be reached before they do. It informs product and pricing, because first products that lead to repeat purchases deserve more prominence than those that do not. And it improves forecasting, since revenue from existing customers can be projected from cohort behaviour rather than guessed.
These uses depend on each team seeing the same figure. Marketing needs CLV by channel, retention teams need it by segment, and finance needs it as margin and payback, all built from one modelled dataset. The principles behind structuring reporting this way are covered in the article on data-driven decision-making with business intelligence.
If your CLV figure comes from a spreadsheet assumption, differs between marketing and finance, or has never been checked against actual order data, the path forward starts with the data layer beneath it. View our data and AI services, explore our engagement plans, see what we have built in our project portfolio, or get in touch and we can assess your current order data and outline what reliable CLV tracking requires.
Engine Analytics is a data analytics company in Singapore that builds the data foundations — customer identity, cohort models, and audience-specific reporting — that ecommerce businesses need to measure customer value accurately and act on it.
Start with historic CLV from your own order data: group customers by first-purchase month and track cumulative net value per customer at fixed intervals such as 90 and 365 days. Measure value after refunds and, where possible, as contribution margin. The simple formula of average order value, purchase frequency, and lifespan is useful as a rough check, but cohort data shows how your customers actually behave.
A ratio of around 3 to 1 is often cited as a benchmark, but it is a rule of thumb rather than a target for every business. The right level depends on gross margin, how quickly customers repeat, and how long the business can wait to earn back acquisition costs. Payback period is often the more useful measure, because it shows how long cash is tied up in each new customer.
Yes. We build the full setup — unified customer identity, cleaned order history in BigQuery, cohort and segment models, predictive CLV where your data supports it, and audience-specific reporting. Get in touch via the Engine Analytics contact page to start with a review of your order data.
— Engine Analytics | Singapore’s data and AI consultancy — building the customer data foundations that let ecommerce teams know what a customer is really worth and spend accordingly.
