
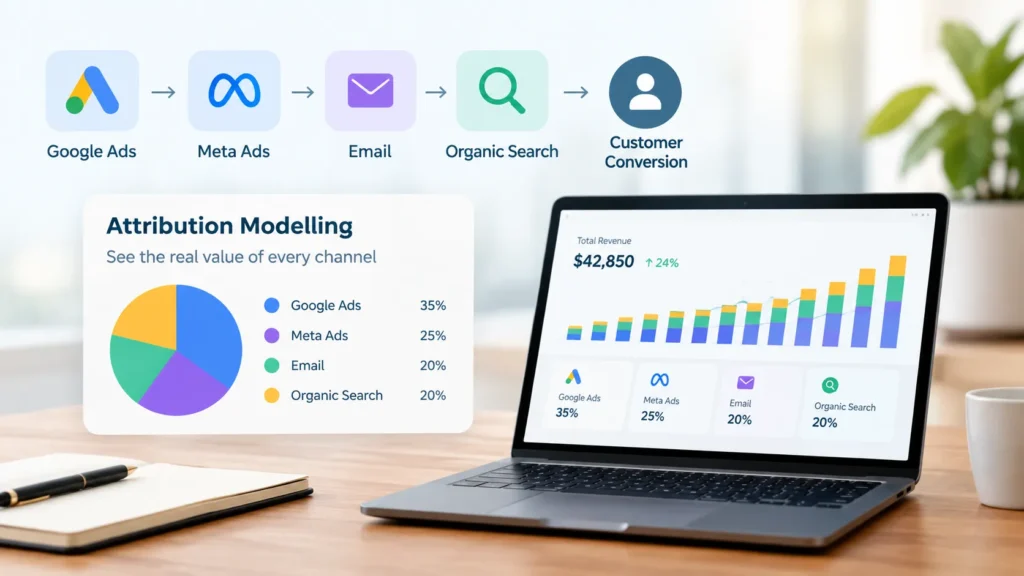
A Singapore ecommerce brand spending $45,000 a month across Google Ads, Meta, and email opens its monthly marketing review with three sets of numbers on the table. Google Ads reports 620 orders for the month. Meta Ads Manager reports 540. Between them, the two platforms are claiming 1,160 orders — against 780 orders actually recorded in the store across every channel, including organic search, direct visits, and returning customers. Nobody in the room can explain how the platforms sold more than the business did, and the meeting moves on to next month’s budget using whichever numbers the person speaking happens to trust.
The marketing lead settles on GA4’s last-click view as the tiebreaker. It shows Meta prospecting campaigns generating very few last-click orders, so the budget is cut by forty percent. Six weeks later, branded search volume has fallen, new-customer orders are down, and the Google Ads numbers that looked healthy the previous month are softening. Meta had been introducing new customers to the brand, many of whom later searched for it by name and converted through a branded Google click. The last-click model credited the branded search and saw nothing else. The cut looked like an efficiency saving; it removed the top of the funnel that the other channels were harvesting.
This is one of the most common situations in marketing analytics, and it does not come from bad tools or careless people. It comes from treating attribution as a report setting rather than as a modelling decision that needs a defined question, clean data, and validation. This article sets out a practical attribution modelling framework for marketing teams — six steps that take a business from conflicting platform reports to a view of channel performance it can defend in a budget meeting. It draws on the approach used by Engine Analytics, a data analytics company in Singapore that builds marketing analytics and data infrastructure for growing businesses.
Each advertising platform attributes conversions using its own rules. It applies its own attribution window, counts the conversions it can see in its own data, and — in many cases — credits itself for people who saw an ad but did not click it, or who clicked and then converted days later on another device. None of the platforms can see what the others did along the same customer journey. When a customer clicks a Meta ad on Monday, opens an email on Wednesday, and buys through a Google search on Friday, all three systems may legitimately report the sale as theirs, each according to its own logic. The disagreement is not an error in any one report; it is what happens when several systems each measure a shared journey from their own side.
Measurement limits make this worse. Browser and device-level privacy controls restrict how much of a journey any tool can follow, and Singapore’s Personal Data Protection Act sets expectations around consent and purpose that marketing tracking needs to respect — so every platform reports a mix of observed and modelled conversions. Platform reporting is useful for optimising inside a channel, such as comparing one ad set with another. It is not a sound basis for deciding how much to spend across channels, because none of the platforms can measure the channels it does not run.
An attribution model is a rule, or a statistical method, for dividing credit for a conversion across the marketing touchpoints that preceded it. The common rule-based models are simple to describe. First-touch gives all the credit to the first interaction and last-touch gives all of it to the final one. Linear splits credit evenly across every touchpoint. Time-decay gives more weight to touches closer to the conversion. Position-based — often called U-shaped — commonly gives around forty percent to the first touch, forty percent to the last, and splits the remaining twenty percent across the middle. Data-driven models use statistical methods to estimate each touchpoint’s contribution from patterns in converting and non-converting journeys.
The important point is that no model is neutral. Each one answers a different question. Last-touch answers “what closed the sale?”, which favours branded search, email, and retargeting. First-touch answers “what started the journey?”, which favours prospecting and awareness channels. Position-based tries to balance the two. Choosing a model is therefore choosing which question the business wants answered — and a team that has not decided that in advance is effectively letting a default setting decide it. Google Analytics 4 illustrates the practical constraint: at the time of writing, it centres its reporting on data-driven and last-click attribution and has removed several of the older rule-based models, which means teams that want to compare models side by side generally need to build that comparison from raw event data rather than from the standard interface.
All of these models share a limit worth stating plainly. They can only distribute credit to interactions that were tracked, and they cannot tell whether a sale would have happened anyway — a customer who was already going to buy and clicked a retargeting ad on the way still gives the model a conversion to assign. What the marketing actually caused is answered by incrementality testing, not by attribution rules, which is why the framework below ends with validation rather than with a model choice.
The most useful first step is not technical. It is agreeing on the decisions the attribution output will be used for, and on what counts as a conversion. Typical decisions include which channels to fund next quarter, whether branded search is being over-credited, how much value content and email are adding to the journey, and what the business can afford to pay to acquire a customer. Each decision points to a different model and a different level of detail, so the list should be written down before any modelling starts.
The conversion definition deserves the same care. For ecommerce, a purchase is the obvious event, though revenue and margin often matter more than order count. For B2B and lead generation, a form submission says nothing about lead quality, so attribution should ideally run against qualified leads or closed-won revenue from the CRM. The rule of thumb is to attribute against the deepest conversion stage that still has enough volume to be meaningful; measuring form fills because they are easy to track is how a business ends up optimising for cheap leads that never close.
Attribution models amplify whatever quality the tracking data has. If campaigns are tagged inconsistently — “facebook”, “Facebook”, and “fb” appearing as three separate sources — channel performance is split across labels and no model can reassemble it. A documented UTM naming convention, a single channel taxonomy that maps every source and medium to a channel group, and consistent conversion event definitions across GA4, the ad platforms, and the CRM are the unglamorous prerequisites. They take days to set up and are the difference between a model that can be trusted and one that produces precise-looking nonsense.
For lead-generation businesses, the second half of the foundation is capturing click and campaign identifiers on the lead record itself, so that when a lead becomes a customer weeks later the CRM can still say where it came from. Offline conversions, such as a sale closed by phone, can then be matched back to the campaign that produced them. Consent handling belongs here too: it determines which journeys are observable, so it should be documented as part of the measurement design rather than treated as a legal afterthought.
A defensible attribution model needs touchpoint data from every channel in one analytical environment. In practice that means landing event-level GA4 data through its BigQuery export, ad spend and click data from each platform through scheduled connectors, and order or CRM data from the systems that record the actual sales — then joining them on shared identifiers into a single table of customer touchpoints. This is the same principle covered in the article on data engineering for business leaders: reporting is only as trustworthy as the layer underneath it. Once the touchpoint table exists, each attribution model becomes a SQL transformation on top of it, which is what makes side-by-side comparison possible and what lets the same definitions feed every dashboard.
For most marketing teams, a daily refresh is enough. Attribution informs budget decisions made weekly or monthly, and streaming pipelines rarely pay back here — the piece on real-time analytics covers the cases where faster data movement is genuinely justified.
With touchpoint data in one place, the practical recommendation is to run more than one model in parallel rather than search for the single correct one. Last-click is worth keeping as a baseline because it is easy to explain and most teams already know its numbers. A position-based or linear model adds the journey view that last-click lacks. Where conversion volume is high enough for stable results, a data-driven model adds a statistical estimate of each channel’s contribution; lower-volume businesses are generally better served by simple rule-based models, because data-driven methods need substantial volume to separate signal from noise.
The most valuable output is the difference between the models, not any one of them. A channel that looks weak under last-click but strong under position-based is doing top-of-funnel work — introducing customers rather than closing them — and cutting it on last-click evidence is exactly the mistake described at the start of this article. A channel that looks strong under every model is a safer place to add budget. That comparison turns attribution from a debate about which number is right into a structured read of where each channel sits in the customer journey.
Every attribution output should pass two checks before it informs a budget decision. The first is reconciliation: the conversions and revenue attributed across all channels should sum to what the business actually recorded, with nothing counted twice. This one check would have exposed the 1,160-versus-780 discrepancy in the opening example immediately, and it is the reason attribution should be built from the business’s own order data rather than from platform reports.
The second check is incrementality. Attribution shows where credit falls; it does not prove that the spend caused the sale. Controlled tests — pausing a channel in a set of regions while keeping it on elsewhere, or running a platform conversion-lift study — measure what the marketing added over and above what would have happened anyway. For businesses with substantial spend across several channels and a long history of results, marketing mix modelling offers a complementary, aggregate-level view that does not depend on user-level tracking at all. None of these methods is complete on its own, so the credible approach is to triangulate: attribution for day-to-day channel comparison, and incrementality tests and, where appropriate, mix modelling to calibrate how far to trust it.
The final step is making the output usable. A performance marketer needs campaign and ad-set detail within the channel they manage. A head of marketing needs the cross-channel view — how the models compare, where budget is working, and where it is not. A CEO or finance lead needs blended measures such as marketing efficiency ratio, blended customer acquisition cost, and payback period, calculated from the business’s own revenue and spend rather than from platform claims. Each audience gets its own view, all reading from the same modelled data so that a conversion means the same thing in every report. The principles behind this structure are covered in the article on data-driven decision-making with business intelligence.
The framework also needs a review rhythm. Channel taxonomies drift as campaigns are launched and platforms change what they report, so a quarterly review of the definitions, model assumptions, and reconciliation checks is what keeps an attribution model that was accurate at launch from quietly degrading.
If your platform reports add up to more than you actually sell, budget decisions rest on whichever number is quoted loudest, or channels are being cut on evidence that only measures the last click, the path forward starts with the data foundation and the question the model must answer — not with another dashboard. View our data and AI services, explore our engagement plans, see what we have built in our project portfolio, or get in touch and we can review your current tracking and reporting and outline what a reliable attribution setup requires for your business.
Engine Analytics is a data analytics company in Singapore that builds the data foundations — unified marketing data layers, consistent metric definitions, and audience-specific reporting — that marketing teams need to move from conflicting platform reports to attribution they can act on.
For most small teams, a combination works better than any single model: last-click as an easy-to-explain baseline, and a position-based or linear model to show which channels introduce customers rather than close them. Data-driven models need high conversion volume to be stable, so they tend to suit larger accounts. Whichever models are used, the more important decisions are defining the conversion properly and building the data from the business’s own order or CRM records.
Because the two tools measure differently. They typically apply different attribution models and windows, Google Ads assigns a conversion to the date of the ad click while GA4 reports it on the date it occurred, and Google Ads may claim conversions that GA4 credits to other channels. Consent settings and modelled conversions add further differences. The gap is normal — the fix is a reconciled view built from the business’s own sales data, not forcing the two tools to match.
Yes. We design and build the full setup — tracking and channel taxonomy review, a unified marketing data layer in BigQuery, attribution models compared side by side, reconciliation against your actual sales data, and audience-specific reporting. Get in touch via the Engine Analytics contact page to start with a review of your current measurement.
— Engine Analytics | Singapore’s data and AI consultancy — building the marketing data foundations that let teams stop arguing over which platform report is right and start making budget decisions from numbers they trust.
