
A marketing manager at a Singapore B2B software company checks Google Ads on a Tuesday morning. The account shows 214 conversions last month at S$62 each. The same afternoon, the CRM shows 71 sales-qualified leads from the same campaigns, because the two systems define a conversion differently. The cost-per-lead figure that reaches the leadership team is built from a spreadsheet where ad spend is copied in by hand each week, so it is always a week old and occasionally wrong. When the CEO asks what a qualified lead costs, three people give three answers, and each of them can defend their arithmetic.
The fix is not a better spreadsheet. It is getting Google Ads data into the same warehouse as the CRM and website data, so that cost, clicks, and conversions can be joined to leads and revenue automatically. This article is a step-by-step guide to Google Ads BigQuery integration — from setting up the transfer to modelling the data so that reports are cleaner and consistent. It draws on the approach used by Engine Analytics, a data analytics company in Singapore that builds marketing data infrastructure for growing businesses.
The goal is a scheduled, automatic copy of Google Ads reporting data in BigQuery, landed raw and then cleaned into tables that analysts and dashboards can use. There are two broad routes. Third-party ELT tools support many advertising platforms through one interface. Google’s own BigQuery Data Transfer Service, a managed service that copies Google Ads data into BigQuery on a schedule without custom code, is the simplest route for Google Ads specifically. For a business whose main paid channel is Google, starting with the Data Transfer Service is usually the right call: it is built by the platform that owns the data, and it keeps the setup light. Other channels such as Meta may need a different connector or a third-party tool depending on what the Data Transfer Service currently supports, so check its connector list — but the modelling principles in this guide apply equally.
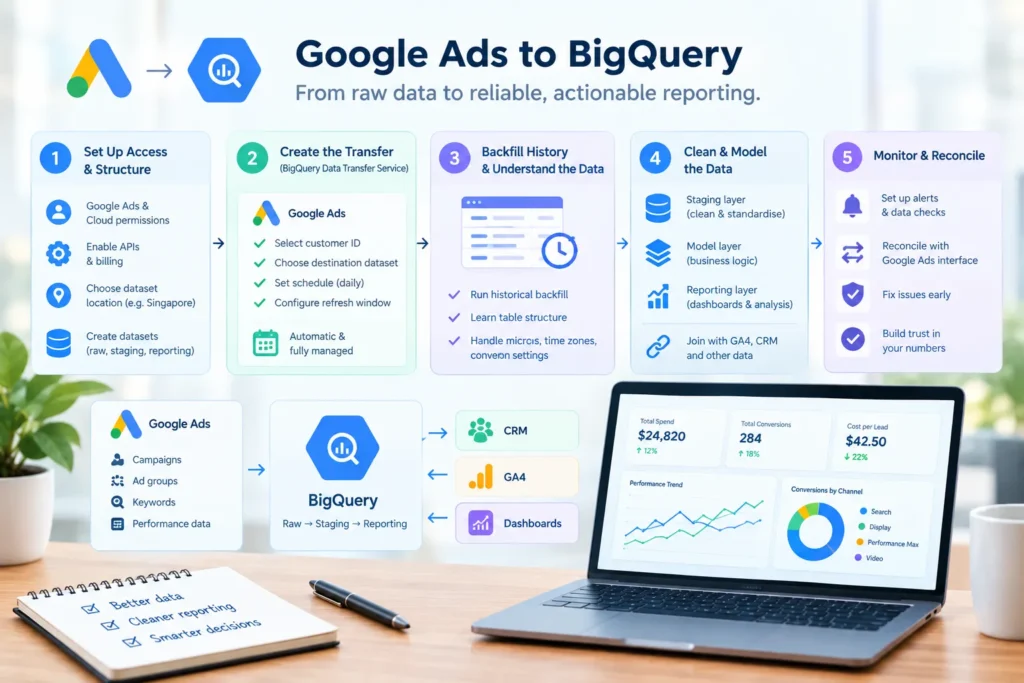
Before creating anything, confirm three things. First, who has the right access: setting up the transfer needs permission on the Google Ads account — or on the manager account if several client or market accounts sit under one — and the right permissions on the Google Cloud project that holds BigQuery. Second, that billing is enabled on the project and the BigQuery Data Transfer API is turned on. Third, where the data will live. BigQuery datasets are created in a specific location, and datasets in different locations cannot be joined in a single query. Choose the location once, in line with where your other marketing and CRM data will sit, and keep it consistent. For Singapore businesses, the Singapore region is a common choice.
It also pays to plan the dataset structure now. A sensible pattern is one dataset for raw Google Ads data exactly as it arrives, a separate dataset for the cleaned staging models, and another for the final reporting tables. Keeping raw data untouched means any later error in the cleaning logic can be corrected without going back to Google.
In the BigQuery console, the Data Transfers section lets you create a new transfer with Google Ads as the source. You provide the Google Ads customer ID — the manager account ID if you want every child account pulled through — choose the destination dataset, and set a schedule, which is daily for most reporting needs. The service then creates the reporting tables for entities such as campaigns, ad groups, ads, and keywords, along with performance-statistics tables broken down by day. The data lands in date-partitioned tables, with views built on top of them, and the table names include the account ID.
Two settings deserve attention. The refresh window determines how many recent days are re-pulled on each run; this matters because Google Ads figures for recent days can change as late conversions and adjustments arrive, and a window that is too short will leave those days permanently understated. And the transfer runs under the credentials of the person who authorised it, so it is wise to authorise it from an account that will still be there next year, rather than a personal login that will be disabled when someone leaves the company.
A new transfer starts collecting from the day it is created, so the next step is a backfill of historical data. The service allows scheduled backfill runs for past dates, within the limits Google sets on how far back it can go, and it is worth running this immediately, since year-on-year comparisons depend on having last year’s data in the same structure as this year’s. If history beyond those limits matters, exporting it separately and loading it once is often a practical fallback.
Then spend time understanding the tables before building anything on them. Google Ads data has quirks that catch teams out. Cost is stored in micros — millionths of the account currency — so it must be divided by one million to give a normal figure. Conversion numbers depend on the conversion actions configured in the account, and the same conversion can be counted differently depending on whether it is reported by the date of the click or the date of the conversion. Getting comfortable with these details early prevents the most common reporting arguments later.
Raw Google Ads tables are not reporting-ready. A staging layer should convert cost from micros, set consistent data types, convert to a single reporting currency where there are several accounts, and align the account time zone with the rest of the warehouse. It should also map campaign names to a channel taxonomy — brand search, non-brand search, performance max, display, and so on — using a documented rule rather than eyeballing campaign titles. A well-modelled table has one row per campaign per day with cost, clicks, impressions, and conversions clearly defined, and a separate view of conversions by conversion action.
The real payoff comes from joining. Ad cost can be matched to website sessions in the GA4 export through campaign identifiers, and to leads and revenue in the CRM through campaign parameters or click identifiers stored on the lead record. That is what turns “cost per conversion” into cost per qualified lead and cost per closed customer, and it is the foundation for the touchpoint analysis described in our article on attribution modelling for marketing teams. For ecommerce brands, the same model joins to order data as described in our guide to building a Shopify and BigQuery analytics stack.
A pipeline that runs silently will eventually fail silently. Set up checks that alert when a transfer fails, when the latest date in the data is older than expected, or when daily row counts or cost drop sharply. Then reconcile: compare monthly cost and conversions in BigQuery against the Google Ads interface. Small differences for the most recent days are normal because of late-arriving data, but closed months should match closely, and any persistent gap points to a modelling error worth finding. Reconciliation also builds trust — once the marketing manager and the finance lead have seen the warehouse figures match the platform, they stop arguing about which number is right. The wider approach to keeping pipelines reliable is covered in our article on data engineering for business leaders.
If your Google Ads spend is still copied into spreadsheets, cost-per-lead figures differ between teams, or paid media cannot be tied to revenue, the path forward is a proper Google Ads pipeline into your warehouse. View our data and AI services, explore our engagement plans, see what we have built in our project portfolio, or get in touch and we can review your current reporting and outline what a reliable integration requires.
Engine Analytics is a data analytics company in Singapore that builds the data foundations — marketing data pipelines, consistent metric definitions, and audience-specific reporting — that businesses need to connect ad spend to real outcomes.
The transfer service is priced separately from BigQuery storage and query costs, and pricing for individual connectors has changed over time, so check Google’s current BigQuery Data Transfer Service pricing page before budgeting. For most businesses, the combined cost of the transfer and of storing and querying Google Ads data is small relative to the ad spend it helps manage.
Small differences are common for recent days because conversions and adjustments arrive late, and the transfer’s refresh window determines how often those days are updated. Larger or persistent gaps usually come from differences in how cost is converted from micros, time zone or currency handling, or whether conversions are reported by click date or conversion date. Reconciling closed months is the best way to find the cause.
Yes. We set up the Google Ads transfer, connect your other sources, model the data into clean reporting tables, add monitoring and reconciliation, and build audience-specific dashboards on top. Get in touch via the Engine Analytics contact page to start with a review of your current marketing reporting.
— Engine Analytics | Singapore’s data and AI consultancy — building the marketing data pipelines that connect ad spend to leads, revenue, and decisions teams can defend.
