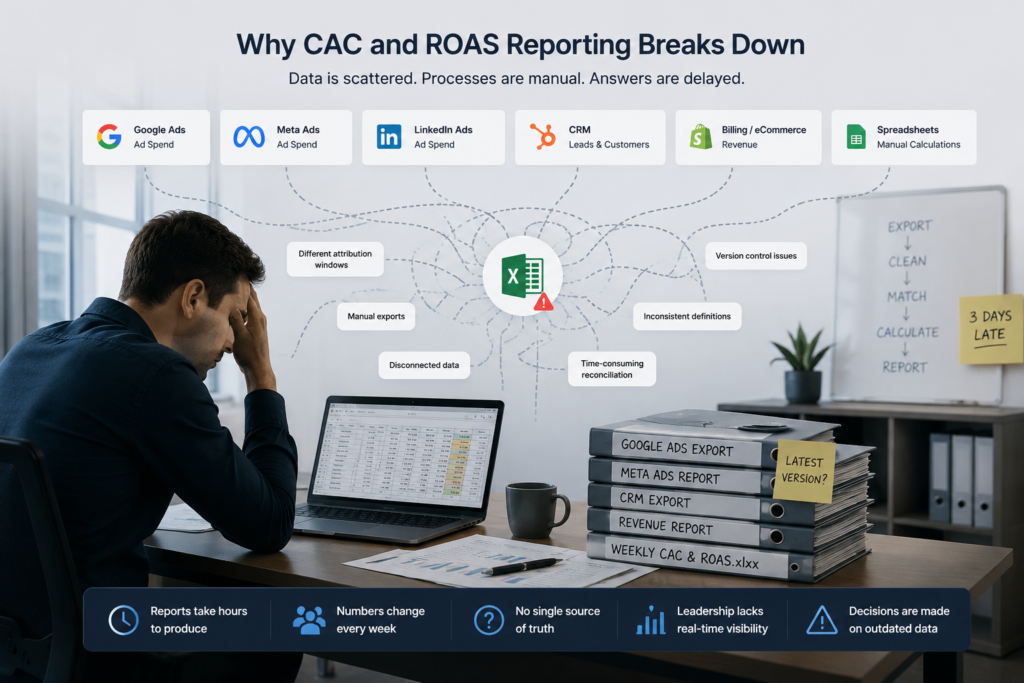
If you have ever sat down on a Monday morning to assemble the weekly performance report, you already know how this plays out. Someone pulls Google Ads data. Someone else exports Meta. A third person grabs the CRM numbers. They all go into a shared spreadsheet, someone reconciles the discrepancies, and by the time the report reaches decision-makers, it is already three days old.
This is how most marketing and growth teams currently track CAC and ROAS. Almost everyone knows it is broken.
The reason it never gets fixed is usually not ignorance — it is the assumption that fixing it requires a complete infrastructure overhaul. New data warehouse. Months of engineering time. A six-figure project. That assumption stops most teams before they start.
It is also wrong. You can automate CAC and ROAS reporting in a way that works reliably and updates in real time, without replacing a single tool in your current stack. This article explains exactly how.
CAC and ROAS are simple in theory.
CAC equals total marketing and sales spend divided by new customers acquired. ROAS equals revenue generated divided by ad spend. Clean, straightforward formulas.
In practice, the data feeding those formulas sits across four or five completely separate systems — ad platforms like Google, Meta, and LinkedIn, your CRM, your billing or eCommerce platform, possibly a product database, and almost certainly at least one spreadsheet acting as informal glue between all of them.
None of these systems communicate with each other natively in a way that produces a single, reliable output. So teams build manual processes around the gaps. Someone exports CSVs. Someone reconciles figures. Someone applies attribution logic that only exists in their head or in an undocumented column formula.
The result is reports that take hours to produce, numbers that shift depending on who pulled them, and leadership asking which version is correct every single week.
The deeper problem is structural. Without a unified data layer, these metrics will always require manual effort to produce. You are not fixing a process problem — you are working around a data architecture problem.
Three things keep this broken longer than it should be.
The first is the belief that fixing it means rebuilding everything. Teams hear “data pipeline” and picture cloud migration, months of engineering effort, and a complete transformation of how data flows through the business. That picture is accurate for some companies. For most, it is not.
The second is a lack of clear ownership. Marketing does not own data infrastructure. Engineering does not own marketing metrics. The gap between those two departments is precisely where this problem lives, and closing it falls to no one by default.
The third is the memory of previous attempts that stalled. Someone tried to build a version in Excel that nobody trusted. Or a BI project started and never reached the reporting stage. Those experiences create reasonable skepticism about whether the problem is actually fixable without enormous effort.
It is fixable. And the approach does not require starting over.
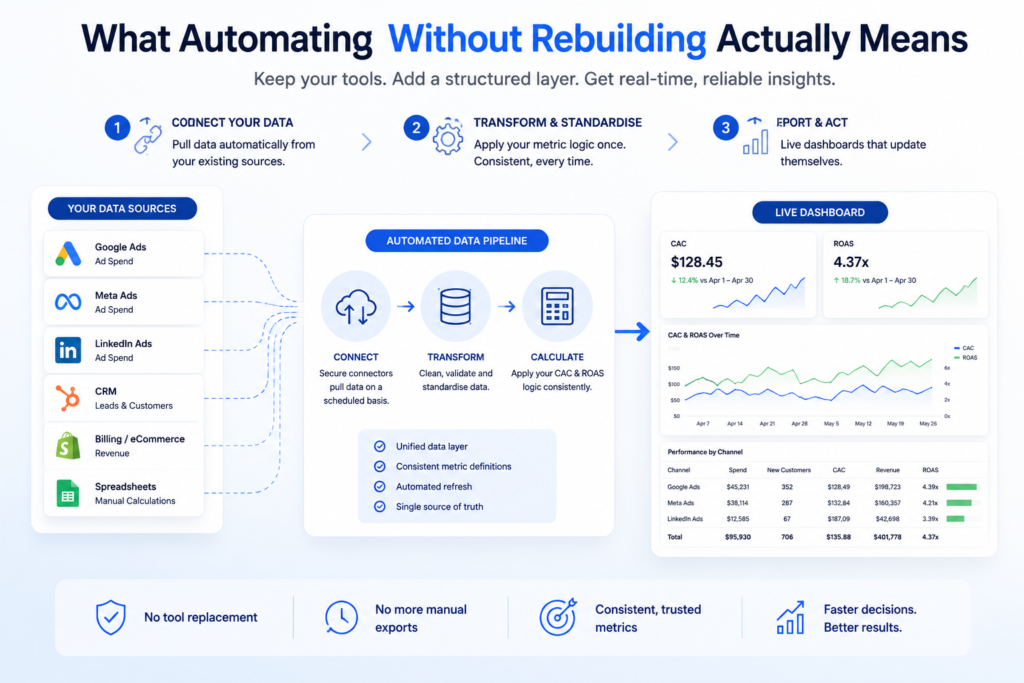
The key shift in thinking is this: you are not replacing your tools. You are adding a structured layer between them and your reporting surface.
Your ad platforms stay. Your CRM stays. Your billing system stays. What changes is how data moves from those systems into a central location, and how your metrics are calculated from that central location in a consistent, automated way.
In practice, this comes down to three components.
First, data connectors that pull from each source automatically — no manual exports, no file uploads. Most modern ad platforms and CRMs expose APIs or support native integrations that make this practical without custom development.
Second, a transformation layer where your CAC and ROAS logic lives. This is where you define, once, exactly what these metrics mean for your business. Once those rules are encoded, they apply consistently every time the data refreshes.
Third, a reporting surface — a dashboard that reads from the transformed data and updates on its own schedule. Nobody emails a spreadsheet. Nobody waits for someone to run a report. The number is there, live, every morning.
This architecture is covered in more detail in our article on building a marketing data pipeline that actually supports performance teams, which covers how this approach works across different types of marketing organisations.
The first practical step is mapping every system that contributes to CAC or ROAS and confirming each one can be accessed programmatically.
For most marketing teams, this means Google Ads, Meta Ads Manager, and LinkedIn Campaign Manager on the paid media side. On the revenue side, it typically means your CRM — HubSpot, Salesforce, or similar — plus your payment processor or eCommerce platform.
Most of these have stable APIs. Several have prebuilt connector tools that require no custom code at all. The goal at this stage is not to move data anywhere yet. It is to confirm that the data can be accessed reliably and understand what fields are available.
If you rely on proprietary or legacy systems, custom connectors are usually faster to build than teams expect. The connection itself is rarely the hard part. What happens next usually is.
This is the step where most automation attempts fail, and it is almost never a technical failure.
Before you automate CAC, your organisation needs to agree on what CAC actually means in your specific context. Does it include salaries? Only paid media spend? What time window applies — monthly, quarterly, rolling thirty days? What counts as an acquired customer — a trial sign-up, a first payment, or a converted MQL?
The same ambiguity exists for ROAS. Are you measuring against gross revenue or margin? Which attribution window applies — last click, first click, or data-driven? Are you including all campaign types or only certain ones?
These are not technical questions. They are business decisions. But once they are made, they need to be written into your data model explicitly — not left in someone’s memory or buried in a formula comment inside a spreadsheet.
When this is done properly, every report produced by the system will show the same number regardless of who pulls it or when. That consistency is what makes the automation valuable. Without it, you have replaced a manual process with an automated one that still produces conflicting outputs.
If your team has struggled with this previously, our article on replacing manual Excel reporting with modern analytics automation covers the practical steps involved in standardising metrics before building the reporting layer.
Once your data is flowing and your metric logic is encoded, the final step is the dashboard.
This is where teams have the most choices. Power BI, Looker, and QuickSight are the most widely used options. The right choice depends on your existing infrastructure, your team’s familiarity, and who needs to access the data. If you are still evaluating tools, our breakdown of QuickSight vs Looker vs Power BI covers the practical differences across use cases.
What matters more than the tool selection is the design of the dashboard itself. CAC and ROAS dashboards that actually get used consistently tend to answer three questions clearly: what are the current numbers, how do they compare to the previous period, and what is driving any significant movement. Everything beyond that tends to add visual complexity without adding decision value.
The dashboard should refresh automatically — daily at minimum, and more frequently if ad spend is high enough to warrant it. No one should trigger a manual refresh or wait for a report to be assembled.
If your marketing team currently spends meaningful time on manual media reporting that could be automated, this is the stage where that time is reclaimed.
Teams consistently overestimate the infrastructure required to automate CAC and ROAS reporting correctly.
You do not need a full data warehouse to start. You do not need an in-house data engineer. You do not need a multi-month project or a large budget. Those things may become relevant as your analytics needs grow, but they are not prerequisites for getting reliable, automated reporting off the ground.
What you do need is clear metric definitions, a reliable connector layer pulling from your existing sources, and a reporting surface the right people can access. In most cases, all three can be in place within a few weeks.
The organisations that see the fastest results are the ones that resist scope creep at this stage. Start with CAC and ROAS. Get those two metrics working accurately and automatically. Expand from there once the foundation is solid. That discipline is more valuable than any particular choice of tool or platform.
At Engine Analytics, we build this type of reporting layer regularly for marketing and growth teams across Singapore and Southeast Asia. The approach stays consistent: we connect to your existing tools, define your metric logic in consultation with your team, and build a dashboard that updates without manual input.
Your stack does not change. The platforms you have already invested in continue working exactly as they do now. We add the pipeline and the reporting layer on top of what you already have.
You can review our data analytics services to understand how this is typically structured, and browse completed projects to see how this plays out across different industries and stack configurations.
For teams that want a predictable cost structure with ongoing support as data sources evolve, our DAaaS plans are designed specifically for this kind of embedded analytics partnership. If you’re ready to stop rebuilding the same report every week, get in touch and we can walk through what automation would look like for your specific stack.
Automating CAC and ROAS reporting is not a data infrastructure project in the traditional sense. It is a structural fix that pays for itself almost immediately — in time reclaimed from manual reporting and in the quality of decisions that follow from having numbers you can actually trust.
The barrier is almost never technical. It is the assumption that doing this properly means starting over from scratch. In practice, the most effective implementations keep every existing tool in place and simply connect them correctly for the first time.
Clean metric definitions. A reliable connector layer. A dashboard that updates itself. That framework is well within reach for most marketing teams, and it does not require a rebuild of anything.
The fastest path is to connect your existing ad platforms and CRM to a centralised data layer using prebuilt connectors, encode your metric definitions once, and surface the results in a dashboard tool like Power BI, Looker, or QuickSight. This avoids replacing any existing tools and can typically be completed in a matter of weeks rather than months. The most important step — and the one teams most often skip — is agreeing on consistent metric definitions before building anything.
No. Many effective marketing reporting setups operate without a full data warehouse, particularly at the early stages. A lightweight pipeline layer that consolidates data from your ad platforms and CRM into a clean, structured format is often sufficient to produce reliable, automated CAC and ROAS dashboards. Data warehouse infrastructure becomes more relevant as data volumes grow or as reporting needs expand significantly beyond core marketing metrics.
Engine Analytics builds the connector and transformation layer on top of your existing stack. Your ad platforms, CRM, and billing systems remain in place. We handle the pipeline that pulls data from each source, apply your agreed metric logic consistently, and deliver a live reporting dashboard that updates automatically. The engagement is designed so your team retains control of the tools they already use while gaining reporting that no longer requires manual effort to produce. Visit the contact page to discuss your specific setup.
