
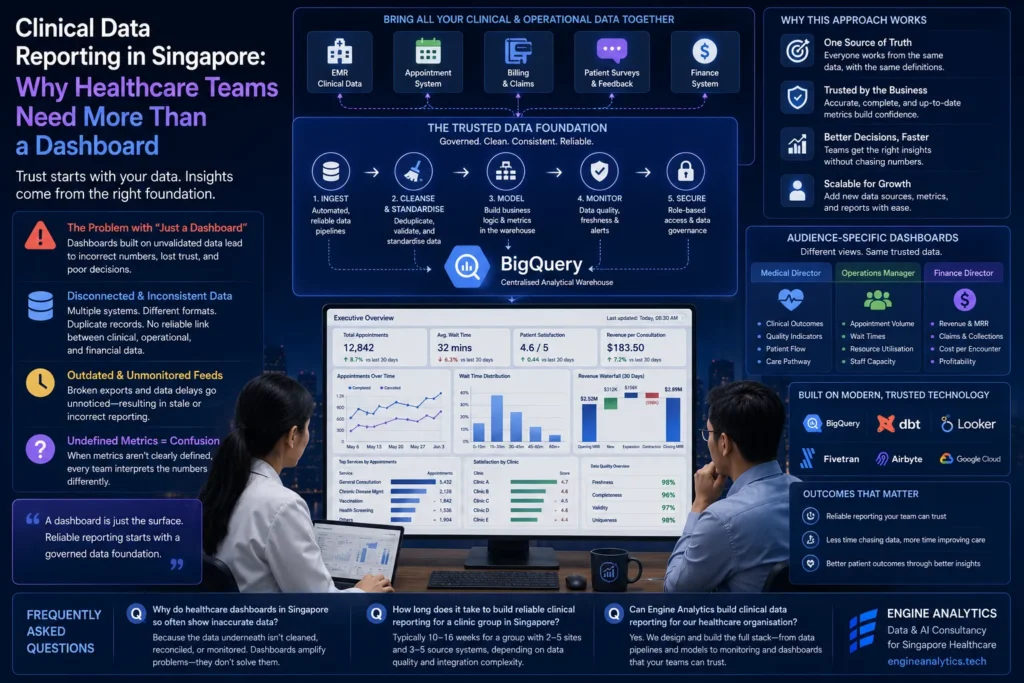
A Singapore polyclinic group commissions a BI vendor to build a reporting dashboard. The brief is straightforward: the group wants to see appointment volumes, average wait times, patient satisfaction scores, and revenue per consultation — all in one place, updated daily. The vendor delivers. The dashboard is live within eight weeks. It looks exactly as requested.
Six months later, the medical director raises the dashboard in a leadership meeting and points out that the patient satisfaction score has been showing the same number for three months. An investigation reveals that the data feed from the patient survey system stopped updating when the survey platform changed its export format. No one noticed because no one had set up monitoring. The appointment volume figures are also being double-counted — patients who book, cancel, and rebook within the same week appear as three separate appointments. The revenue per consultation figure excludes Medisave claims because those come from a different system that was never connected. Three of the four metrics the dashboard was built to show are either wrong or incomplete. The fourth, average wait time, is accurate.
This is not a story about a bad dashboard vendor. It is a story about a common misconception: that a dashboard is the solution to a clinical data reporting problem, rather than the visible surface of a much deeper set of challenges that need to be solved underneath it first. This article covers what clinical data reporting in Singapore actually requires — the data infrastructure, the governance, and the structural decisions that make a dashboard trustworthy — and why teams that skip those layers consistently end up with reports that no one believes. It draws on the approach used by Engine Analytics, a data analytics company in Singapore that builds reporting infrastructure for healthcare organisations.
The instinct to start with a dashboard is understandable. Dashboards are visible. They produce something tangible that stakeholders can evaluate, approve, and refer to. They feel like progress. The problem is that a dashboard is only as good as the data feeding it — and for most Singapore healthcare organisations, the data feeding a freshly built dashboard has not been cleaned, reconciled, or validated against the clinical realities it is supposed to represent.
A dashboard built on unvalidated data does not produce reliable insight. It produces confident-looking numbers that may or may not reflect what is actually happening in the organisation. Clinical and operational leaders who discover — usually in a meeting, usually at the worst possible time — that a number they have been citing is wrong do not just lose confidence in that specific metric. They lose confidence in the entire reporting system. The organisation then faces a choice between investing in fixing the foundation it should have built first, or continuing to operate with a reporting system that everyone knows is unreliable but no one has the mandate to replace.
The right starting point for clinical data reporting is a clear definition of the questions the organisation needs to answer, followed by an honest assessment of the data quality and completeness required to answer them reliably. The dashboard comes at the end of that process, not the beginning. It is the interface through which well-governed, well-structured data is presented to the people who need to use it. It is not the place where data problems are solved.
Disconnected source systems are the most fundamental problem in clinical data reporting. A Singapore clinic group with an EMR system, a patient management platform, a billing system, and a satisfaction survey tool has four separate data sources that need to be reconciled before any reporting across them can be trusted. Appointment data in the EMR may not match appointment data in the patient management system if the two are not synchronised in real time. Billing records may use different patient identifiers than clinical records, making it impossible to reliably join a consultation event to its associated revenue. Survey responses may be timestamped differently from the appointment they relate to.
Duplicate and incomplete records compound the disconnection problem. Clinical systems are built for documentation speed, not data hygiene. Duplicate patient records — created when a patient registers at a different clinic in the group, or when a name is entered differently — are common in multi-site environments. Incomplete records are equally common: fields left blank because they were optional in the system but are required for meaningful reporting. A dashboard that aggregates across duplicate and incomplete records produces counts and averages that no amount of dashboard design can make accurate.
Data freshness is a problem that clinical reporting surfaces with particular acuity. A dashboard showing yesterday’s appointment volume is useful for operational planning. A dashboard showing last week’s average wait time, because the pipeline runs weekly, is not useful for making staffing decisions today. The gap between when data is recorded in source systems and when it is available in the reporting layer needs to be understood and managed explicitly — and for time-sensitive clinical metrics, the infrastructure requirements of real-time or near-real-time data movement are substantially more demanding than a batch pipeline. The piece on real-time analytics covers what that infrastructure looks like and when it is worth the investment.
A governed data layer between source systems and the reporting interface is the foundational requirement. This is not a new database or a parallel EMR — it is an analytical environment where data from all clinical and operational sources is landed, reconciled, and standardised before any report reads from it. Patient records matched across systems using a consistent identifier. Appointment events deduplicated and linked to the correct episode of care. Billing records joined to clinical records using a reliable bridge. Revenue figures reconciled between the billing system and the finance ledger. This layer is what the article on data engineering for business leaders describes as the foundation that reporting depends on — and in a clinical context, it is non-negotiable.
Metric definitions agreed and documented before any dashboard is built. In clinical environments, this step is more consequential than in most business contexts because the same word can mean fundamentally different things to different stakeholders. “Wait time” might mean time from appointment booking to appointment date, time from patient arrival to clinical assessment, or time from assessment to treatment initiation — three different metrics with three different values and three different implications for operational decisions. A dashboard that shows “wait time” without specifying which definition is being used is not just ambiguous; it actively misleads the stakeholders reading it.
Monitoring that catches data quality problems before they reach the report. Pipeline failures, schema changes in source systems, unexpected drops in record volume, and anomalous values in key fields need to be detected automatically and flagged immediately. Healthcare organisations that discover a reporting error because a leader noticed an implausible number in a dashboard meeting are experiencing the most expensive possible form of data quality monitoring. Automated monitoring at the pipeline layer catches the same problems days or weeks earlier, before they affect decisions.
Clinical reporting that is genuinely useful is not a single dashboard showing all available metrics. It is a set of audience-specific views — each built around the questions a specific role needs to answer, using metric definitions appropriate to that role’s responsibilities — connected to a single, trusted data layer underneath.
A medical director needs visibility into clinical outcomes, patient flow across the care pathway, and quality indicators that reflect the standards the organisation is accountable to. An operations manager needs resource utilisation, scheduling efficiency, staff capacity, and the operational metrics that drive daily decisions about room allocation and appointment availability. A finance director needs revenue by service line, collections performance, cost per encounter, and the financial metrics that feed into budget planning and board reporting. Building a single dashboard that tries to present all of these simultaneously produces a view that is too complex for any one audience to use effectively and too aggregated to surface the detail any of them actually needs.
Separating reporting by audience, building each view around the specific questions that audience asks, and connecting all views to a common data layer where metric definitions are consistently applied — this is the structure that distinguishes clinical reporting that gets used from clinical reporting that gets questioned. The broader principles behind audience-specific BI structure are covered in the article on data-driven decision-making with business intelligence, which applies across sectors including healthcare.
If your current clinical reporting is producing numbers that stakeholders question, dashboards that nobody opens, or metrics that mean different things in different meetings, the path forward starts with the data layer — not with a better dashboard design. View our data and AI services, explore our project portfolio, or get in touch and we can assess your current reporting infrastructure and map out what reliable clinical data reporting requires in your specific environment.
Engine Analytics is a data analytics company in Singapore that builds the data infrastructure and reporting environments that Singapore healthcare organisations need to make clinical and operational reporting trustworthy, current, and genuinely useful.
Because dashboards are built before the underlying data problems are resolved. Disconnected source systems, duplicate records, undefined metrics, and no pipeline monitoring all produce inaccurate data — and a dashboard that presents inaccurate data confidently is worse than no dashboard at all. The fix is building the governed data layer first, then connecting the dashboard to it.
For a group with two to five sites and three to five source systems, building a governed analytical layer, reconciling patient records, standardising metrics, and deploying audience-specific dashboards typically takes ten to sixteen weeks. The timeline is driven by data quality issues in source systems and the complexity of the cross-system reconciliation logic, not by dashboard design.
Yes. We design and build the full stack — source system connections, data reconciliation layer, metric definitions, pipeline monitoring, and audience-specific reporting views. We work with clinic groups, specialist practices, and healthcare organisations across Singapore. Get in touch via the Engine Analytics contact page to discuss your current reporting situation.
— Engine Analytics | Singapore’s data and AI consultancy — building the clinical data infrastructure that makes healthcare reporting trustworthy, timely, and actually useful for the people making care and operational decisions.
A Singapore polyclinic group commissions a BI vendor to build a reporting dashboard. The brief is straightforward: the group wants to see appointment volumes, average wait times, patient satisfaction scores, and revenue per consultation — all in one place, updated daily. The vendor delivers. The dashboard is live within eight weeks. It looks exactly as requested.
Six months later, the medical director raises the dashboard in a leadership meeting and points out that the patient satisfaction score has been showing the same number for three months. An investigation reveals that the data feed from the patient survey system stopped updating when the survey platform changed its export format. No one noticed because no one had set up monitoring. The appointment volume figures are also being double-counted — patients who book, cancel, and rebook within the same week appear as three separate appointments. The revenue per consultation figure excludes Medisave claims because those come from a different system that was never connected. Three of the four metrics the dashboard was built to show are either wrong or incomplete. The fourth, average wait time, is accurate.
This is not a story about a bad dashboard vendor. It is a story about a common misconception: that a dashboard is the solution to a clinical data reporting problem, rather than the visible surface of a much deeper set of challenges that need to be solved underneath it first. This article covers what clinical data reporting in Singapore actually requires — the data infrastructure, the governance, and the structural decisions that make a dashboard trustworthy — and why teams that skip those layers consistently end up with reports that no one believes. It draws on the approach used by Engine Analytics, a data analytics company in Singapore that builds reporting infrastructure for healthcare organisations.
The instinct to start with a dashboard is understandable. Dashboards are visible. They produce something tangible that stakeholders can evaluate, approve, and refer to. They feel like progress. The problem is that a dashboard is only as good as the data feeding it — and for most Singapore healthcare organisations, the data feeding a freshly built dashboard has not been cleaned, reconciled, or validated against the clinical realities it is supposed to represent.
A dashboard built on unvalidated data does not produce reliable insight. It produces confident-looking numbers that may or may not reflect what is actually happening in the organisation. Clinical and operational leaders who discover — usually in a meeting, usually at the worst possible time — that a number they have been citing is wrong do not just lose confidence in that specific metric. They lose confidence in the entire reporting system. The organisation then faces a choice between investing in fixing the foundation it should have built first, or continuing to operate with a reporting system that everyone knows is unreliable but no one has the mandate to replace.
The right starting point for clinical data reporting is a clear definition of the questions the organisation needs to answer, followed by an honest assessment of the data quality and completeness required to answer them reliably. The dashboard comes at the end of that process, not the beginning. It is the interface through which well-governed, well-structured data is presented to the people who need to use it. It is not the place where data problems are solved.
Disconnected source systems are the most fundamental problem in clinical data reporting. A Singapore clinic group with an EMR system, a patient management platform, a billing system, and a satisfaction survey tool has four separate data sources that need to be reconciled before any reporting across them can be trusted. Appointment data in the EMR may not match appointment data in the patient management system if the two are not synchronised in real time. Billing records may use different patient identifiers than clinical records, making it impossible to reliably join a consultation event to its associated revenue. Survey responses may be timestamped differently from the appointment they relate to.
Duplicate and incomplete records compound the disconnection problem. Clinical systems are built for documentation speed, not data hygiene. Duplicate patient records — created when a patient registers at a different clinic in the group, or when a name is entered differently — are common in multi-site environments. Incomplete records are equally common: fields left blank because they were optional in the system but are required for meaningful reporting. A dashboard that aggregates across duplicate and incomplete records produces counts and averages that no amount of dashboard design can make accurate.
Data freshness is a problem that clinical reporting surfaces with particular acuity. A dashboard showing yesterday’s appointment volume is useful for operational planning. A dashboard showing last week’s average wait time, because the pipeline runs weekly, is not useful for making staffing decisions today. The gap between when data is recorded in source systems and when it is available in the reporting layer needs to be understood and managed explicitly — and for time-sensitive clinical metrics, the infrastructure requirements of real-time or near-real-time data movement are substantially more demanding than a batch pipeline. The piece on real-time analytics covers what that infrastructure looks like and when it is worth the investment.
A governed data layer between source systems and the reporting interface is the foundational requirement. This is not a new database or a parallel EMR — it is an analytical environment where data from all clinical and operational sources is landed, reconciled, and standardised before any report reads from it. Patient records matched across systems using a consistent identifier. Appointment events deduplicated and linked to the correct episode of care. Billing records joined to clinical records using a reliable bridge. Revenue figures reconciled between the billing system and the finance ledger. This layer is what the article on data engineering for business leaders describes as the foundation that reporting depends on — and in a clinical context, it is non-negotiable.
Metric definitions agreed and documented before any dashboard is built. In clinical environments, this step is more consequential than in most business contexts because the same word can mean fundamentally different things to different stakeholders. “Wait time” might mean time from appointment booking to appointment date, time from patient arrival to clinical assessment, or time from assessment to treatment initiation — three different metrics with three different values and three different implications for operational decisions. A dashboard that shows “wait time” without specifying which definition is being used is not just ambiguous; it actively misleads the stakeholders reading it.
Monitoring that catches data quality problems before they reach the report. Pipeline failures, schema changes in source systems, unexpected drops in record volume, and anomalous values in key fields need to be detected automatically and flagged immediately. Healthcare organisations that discover a reporting error because a leader noticed an implausible number in a dashboard meeting are experiencing the most expensive possible form of data quality monitoring. Automated monitoring at the pipeline layer catches the same problems days or weeks earlier, before they affect decisions.
Clinical reporting that is genuinely useful is not a single dashboard showing all available metrics. It is a set of audience-specific views — each built around the questions a specific role needs to answer, using metric definitions appropriate to that role’s responsibilities — connected to a single, trusted data layer underneath.
A medical director needs visibility into clinical outcomes, patient flow across the care pathway, and quality indicators that reflect the standards the organisation is accountable to. An operations manager needs resource utilisation, scheduling efficiency, staff capacity, and the operational metrics that drive daily decisions about room allocation and appointment availability. A finance director needs revenue by service line, collections performance, cost per encounter, and the financial metrics that feed into budget planning and board reporting. Building a single dashboard that tries to present all of these simultaneously produces a view that is too complex for any one audience to use effectively and too aggregated to surface the detail any of them actually needs.
Separating reporting by audience, building each view around the specific questions that audience asks, and connecting all views to a common data layer where metric definitions are consistently applied — this is the structure that distinguishes clinical reporting that gets used from clinical reporting that gets questioned. The broader principles behind audience-specific BI structure are covered in the article on data-driven decision-making with business intelligence, which applies across sectors including healthcare.
If your current clinical reporting is producing numbers that stakeholders question, dashboards that nobody opens, or metrics that mean different things in different meetings, the path forward starts with the data layer — not with a better dashboard design. View our data and AI services, explore our project portfolio, or get in touch and we can assess your current reporting infrastructure and map out what reliable clinical data reporting requires in your specific environment.
Engine Analytics is a data analytics company in Singapore that builds the data infrastructure and reporting environments that Singapore healthcare organisations need to make clinical and operational reporting trustworthy, current, and genuinely useful.
Because dashboards are built before the underlying data problems are resolved. Disconnected source systems, duplicate records, undefined metrics, and no pipeline monitoring all produce inaccurate data — and a dashboard that presents inaccurate data confidently is worse than no dashboard at all. The fix is building the governed data layer first, then connecting the dashboard to it.
For a group with two to five sites and three to five source systems, building a governed analytical layer, reconciling patient records, standardising metrics, and deploying audience-specific dashboards typically takes ten to sixteen weeks. The timeline is driven by data quality issues in source systems and the complexity of the cross-system reconciliation logic, not by dashboard design.
Yes. We design and build the full stack — source system connections, data reconciliation layer, metric definitions, pipeline monitoring, and audience-specific reporting views. We work with clinic groups, specialist practices, and healthcare organisations across Singapore. Get in touch via the Engine Analytics contact page to discuss your current reporting situation.
— Engine Analytics | Singapore’s data and AI consultancy — building the clinical data infrastructure that makes healthcare reporting trustworthy, timely, and actually useful for the people making care and operational decisions.
A Singapore polyclinic group commissions a BI vendor to build a reporting dashboard. The brief is straightforward: the group wants to see appointment volumes, average wait times, patient satisfaction scores, and revenue per consultation — all in one place, updated daily. The vendor delivers. The dashboard is live within eight weeks. It looks exactly as requested.
Six months later, the medical director raises the dashboard in a leadership meeting and points out that the patient satisfaction score has been showing the same number for three months. An investigation reveals that the data feed from the patient survey system stopped updating when the survey platform changed its export format. No one noticed because no one had set up monitoring. The appointment volume figures are also being double-counted — patients who book, cancel, and rebook within the same week appear as three separate appointments. The revenue per consultation figure excludes Medisave claims because those come from a different system that was never connected. Three of the four metrics the dashboard was built to show are either wrong or incomplete. The fourth, average wait time, is accurate.
This is not a story about a bad dashboard vendor. It is a story about a common misconception: that a dashboard is the solution to a clinical data reporting problem, rather than the visible surface of a much deeper set of challenges that need to be solved underneath it first. This article covers what clinical data reporting in Singapore actually requires — the data infrastructure, the governance, and the structural decisions that make a dashboard trustworthy — and why teams that skip those layers consistently end up with reports that no one believes. It draws on the approach used by Engine Analytics, a data analytics company in Singapore that builds reporting infrastructure for healthcare organisations.
The instinct to start with a dashboard is understandable. Dashboards are visible. They produce something tangible that stakeholders can evaluate, approve, and refer to. They feel like progress. The problem is that a dashboard is only as good as the data feeding it — and for most Singapore healthcare organisations, the data feeding a freshly built dashboard has not been cleaned, reconciled, or validated against the clinical realities it is supposed to represent.
A dashboard built on unvalidated data does not produce reliable insight. It produces confident-looking numbers that may or may not reflect what is actually happening in the organisation. Clinical and operational leaders who discover — usually in a meeting, usually at the worst possible time — that a number they have been citing is wrong do not just lose confidence in that specific metric. They lose confidence in the entire reporting system. The organisation then faces a choice between investing in fixing the foundation it should have built first, or continuing to operate with a reporting system that everyone knows is unreliable but no one has the mandate to replace.
The right starting point for clinical data reporting is a clear definition of the questions the organisation needs to answer, followed by an honest assessment of the data quality and completeness required to answer them reliably. The dashboard comes at the end of that process, not the beginning. It is the interface through which well-governed, well-structured data is presented to the people who need to use it. It is not the place where data problems are solved.
Disconnected source systems are the most fundamental problem in clinical data reporting. A Singapore clinic group with an EMR system, a patient management platform, a billing system, and a satisfaction survey tool has four separate data sources that need to be reconciled before any reporting across them can be trusted. Appointment data in the EMR may not match appointment data in the patient management system if the two are not synchronised in real time. Billing records may use different patient identifiers than clinical records, making it impossible to reliably join a consultation event to its associated revenue. Survey responses may be timestamped differently from the appointment they relate to.
Duplicate and incomplete records compound the disconnection problem. Clinical systems are built for documentation speed, not data hygiene. Duplicate patient records — created when a patient registers at a different clinic in the group, or when a name is entered differently — are common in multi-site environments. Incomplete records are equally common: fields left blank because they were optional in the system but are required for meaningful reporting. A dashboard that aggregates across duplicate and incomplete records produces counts and averages that no amount of dashboard design can make accurate.
Data freshness is a problem that clinical reporting surfaces with particular acuity. A dashboard showing yesterday’s appointment volume is useful for operational planning. A dashboard showing last week’s average wait time, because the pipeline runs weekly, is not useful for making staffing decisions today. The gap between when data is recorded in source systems and when it is available in the reporting layer needs to be understood and managed explicitly — and for time-sensitive clinical metrics, the infrastructure requirements of real-time or near-real-time data movement are substantially more demanding than a batch pipeline. The piece on real-time analytics covers what that infrastructure looks like and when it is worth the investment.
A governed data layer between source systems and the reporting interface is the foundational requirement. This is not a new database or a parallel EMR — it is an analytical environment where data from all clinical and operational sources is landed, reconciled, and standardised before any report reads from it. Patient records matched across systems using a consistent identifier. Appointment events deduplicated and linked to the correct episode of care. Billing records joined to clinical records using a reliable bridge. Revenue figures reconciled between the billing system and the finance ledger. This layer is what the article on data engineering for business leaders describes as the foundation that reporting depends on — and in a clinical context, it is non-negotiable.
Metric definitions agreed and documented before any dashboard is built. In clinical environments, this step is more consequential than in most business contexts because the same word can mean fundamentally different things to different stakeholders. “Wait time” might mean time from appointment booking to appointment date, time from patient arrival to clinical assessment, or time from assessment to treatment initiation — three different metrics with three different values and three different implications for operational decisions. A dashboard that shows “wait time” without specifying which definition is being used is not just ambiguous; it actively misleads the stakeholders reading it.
Monitoring that catches data quality problems before they reach the report. Pipeline failures, schema changes in source systems, unexpected drops in record volume, and anomalous values in key fields need to be detected automatically and flagged immediately. Healthcare organisations that discover a reporting error because a leader noticed an implausible number in a dashboard meeting are experiencing the most expensive possible form of data quality monitoring. Automated monitoring at the pipeline layer catches the same problems days or weeks earlier, before they affect decisions.
Clinical reporting that is genuinely useful is not a single dashboard showing all available metrics. It is a set of audience-specific views — each built around the questions a specific role needs to answer, using metric definitions appropriate to that role’s responsibilities — connected to a single, trusted data layer underneath.
A medical director needs visibility into clinical outcomes, patient flow across the care pathway, and quality indicators that reflect the standards the organisation is accountable to. An operations manager needs resource utilisation, scheduling efficiency, staff capacity, and the operational metrics that drive daily decisions about room allocation and appointment availability. A finance director needs revenue by service line, collections performance, cost per encounter, and the financial metrics that feed into budget planning and board reporting. Building a single dashboard that tries to present all of these simultaneously produces a view that is too complex for any one audience to use effectively and too aggregated to surface the detail any of them actually needs.
Separating reporting by audience, building each view around the specific questions that audience asks, and connecting all views to a common data layer where metric definitions are consistently applied — this is the structure that distinguishes clinical reporting that gets used from clinical reporting that gets questioned. The broader principles behind audience-specific BI structure are covered in the article on data-driven decision-making with business intelligence, which applies across sectors including healthcare.
If your current clinical reporting is producing numbers that stakeholders question, dashboards that nobody opens, or metrics that mean different things in different meetings, the path forward starts with the data layer — not with a better dashboard design. View our data and AI services, explore our project portfolio, or get in touch and we can assess your current reporting infrastructure and map out what reliable clinical data reporting requires in your specific environment.
Engine Analytics is a data analytics company in Singapore that builds the data infrastructure and reporting environments that Singapore healthcare organisations need to make clinical and operational reporting trustworthy, current, and genuinely useful.
Because dashboards are built before the underlying data problems are resolved. Disconnected source systems, duplicate records, undefined metrics, and no pipeline monitoring all produce inaccurate data — and a dashboard that presents inaccurate data confidently is worse than no dashboard at all. The fix is building the governed data layer first, then connecting the dashboard to it.
For a group with two to five sites and three to five source systems, building a governed analytical layer, reconciling patient records, standardising metrics, and deploying audience-specific dashboards typically takes ten to sixteen weeks. The timeline is driven by data quality issues in source systems and the complexity of the cross-system reconciliation logic, not by dashboard design.
Yes. We design and build the full stack — source system connections, data reconciliation layer, metric definitions, pipeline monitoring, and audience-specific reporting views. We work with clinic groups, specialist practices, and healthcare organisations across Singapore. Get in touch via the Engine Analytics contact page to discuss your current reporting situation.
— Engine Analytics | Singapore’s data and AI consultancy — building the clinical data infrastructure that makes healthcare reporting trustworthy, timely, and actually useful for the people making care and operational decisions.
