Business intelligence dashboards provide real-time data, streamline reporting, enable data-driven decisions, and enhance data sharing across departments. They also help in identifying workflow inefficiencies and maintaining a competitive edge.
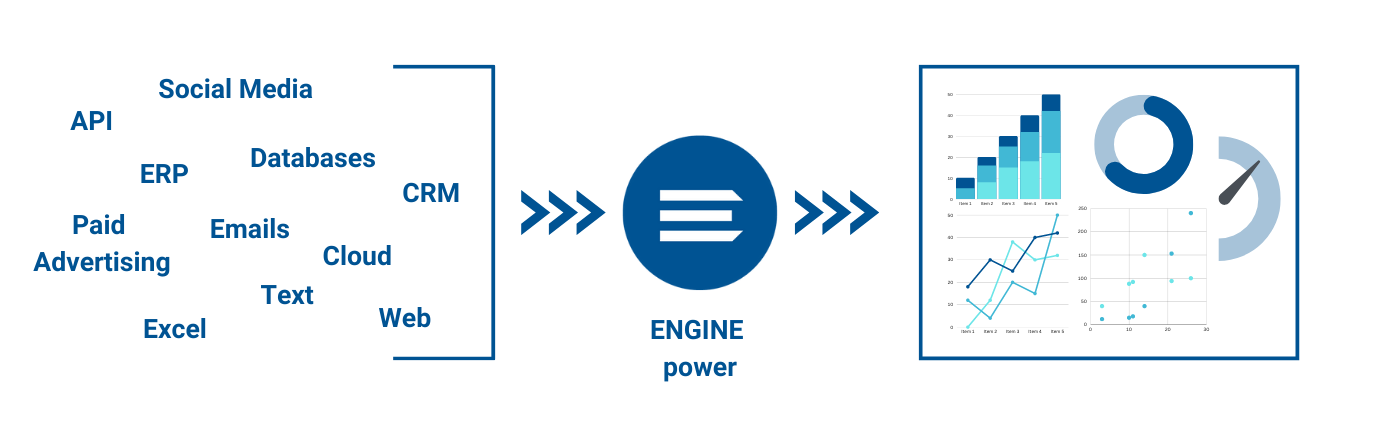
Business intelligence (BI) dashboards are data visualization and analysis tools that businesses use to display on a screen the status of different key performance indicators (KPI) and other essential business metrics for their business workflow processes. No more using multiple Google Sheets or PowerPoint slides with static data to know the status of your business. Business Intelligence dashboards are a must-have for businesses looking to stay competitive in today’s changing economic landscape.
Benefits of Engine’s Business Intelligence Dashboards
Business intelligence dashboard software provides many benefits to businesses by enabling them to have a bird-eye view of their performance. Here are a couple of benefits that business intelligence dashboard software can provide your business:
Business intelligence dashboard software allows embedding key performance indicators (KPIs) that are updated in real-time, providing instant analytics insights to your company’s employees.
Business dashboards come equipped with KPI tracking features that have eliminated traditional reporting, monitoring, analyzing, and generating data insights using spreadsheets or PowerPoint presentations. Using modern intelligent technologies such as predictive analytics, artificial intelligence, machine learning, and neural networks, business intelligence dashboard software has eliminated static reporting and simplified the reporting process.
Business dashboard software also ensures that departments no longer work in isolated departmental silos but within a platform that allows employees access to data across multiple departments under a single view. This holistic access to data enables employees to make better decisions supported by accurate, real-time data.
The business analysis dashboard provides a single-screen view of business workflow processes in real-time, which results in faster data-sharing processes. No need to wait for weeks to generate reports. Now can quickly generate all the essential KPIs in a single place.
Business analysis dashboard software tracks KPIs in real-time. This allows your business to identify inefficiencies in its workflow processes. Such as production, employee performance, supplier relationships, etc. This enables you to find appropriate solutions based on accurate data, saving your business time and money.
Business competitiveness is a critical component in growth. A business analysis dashboard provides businesses with access to reliable, intuitive, and accurate data in their industry. This will enable you to uncover all the hidden analytics insights and position you to stay ahead of your competition.
Business intelligence dashboards allow the tracking of KPIs across a wide variety of important metrics. Here are a couple of business intelligence dashboards:
An eCommerce or product dashboard is a user interface that displays a set of metrics and KPIs. Such as business sales, revenue, products, and customers. An eCommerce dashboard provides businesses with a clear overview of critical financial KPIs.
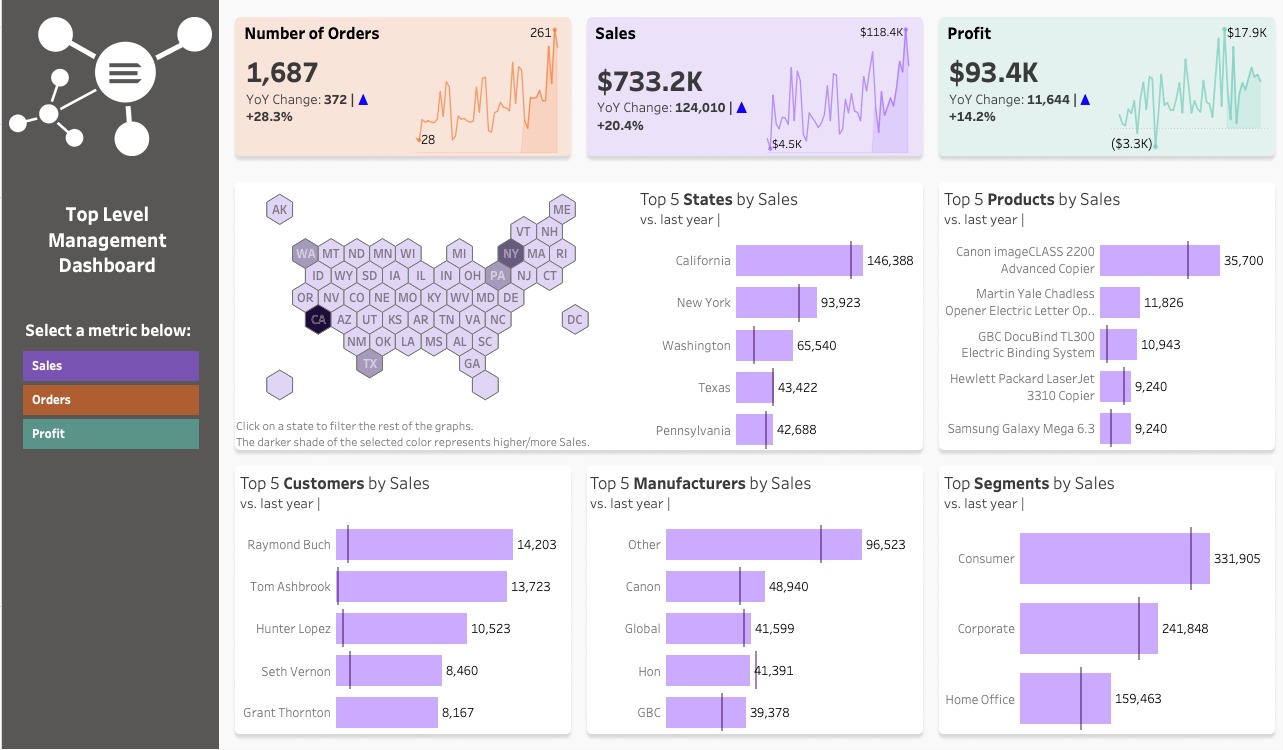
Full dashboard available on Tableau Server.
eCommerce Dashboard KPIs for Tracking
Average Order Value – The average value of transactions within a specified date range.
eCommerce Conversion Rate – A percentage of sessions that resulted in an eCommerce transaction within a specified date range.
Total Revenue by Channels – Amount in monetary value generated via a business eCommerce platform; website, in-app in total or split up by channels; clothing, household items, etc.
Users – Visitors to your eCommerce platforms that have initiated at least one session within a specified date range.
These types of dashboards can help you detect issues with your eCommerce platforms, such as; website downtime, low stock, and order fulfilment issues, among others. This allows you to fix the issue in real time and be proactive rather than reactive, which saves your business from lost productivity. You will be able to get a better and deeper understanding of your customer behavior, enabling you to adjust and develop appropriate strategies that increase your business productivity.
Customer Relationship Management & Marketing Dashboard
A CRM dashboard is a visual, customizable user interface for CRM software. It provides you with a broad overview of sales activities, such as; leads and sales pipelines. It is used to monitor, measure, and analyze business and sales processes and even provide insights into future opportunities in real-time to help businesses make well-informed marketing decisions.
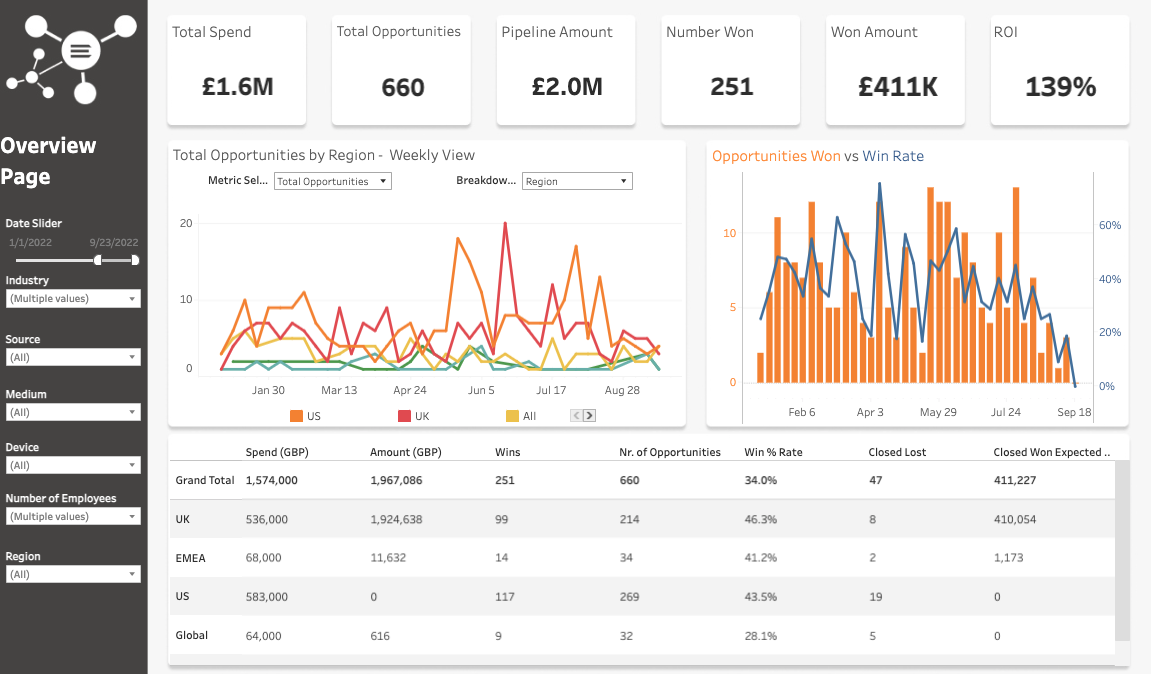
Full Dashboard available on Tableau Public.
Sales Target – Lets salespeople know where they are in relation to meeting their goals
Lead Conversion Ratio – Number of leads that convert to customers
Revenue Per Sales Rep – Performance of sales team against established baseline; budgeted revenue goal, top performers, duration a sales rep takes to clinch a sale
Cost Per Acquisition (CPA) – Provides the cost of acquiring a single customer across different channels
Return On Investment (ROI) – Examines the efficiency of an investment and is used to determine which channels or campaigns to invest your marketing resources in.
Customer Lifetime Value (CLTV) – Provides the average lifetime value of a customer based on available data. It is calculated by the average order total multiplied by the average number of purchases in a year multiplied by the average retention time in years.
Customer Satisfaction – Provides insights into the impression that customers have of your brand. It usually entails a rating of individual customer experiences with your brand and expressed as a percentage, indicating satisfaction or dissatisfaction.
Net Promoter Score (NPS) – NPS measures the likelihood of your customers recommending your brand to someone. This helps you gauge your customers’ loyalty to your brand so that you can come up with appropriate strategies.
Customer Retention – Measures your customers’ loyalty to your brand by calculating the number of repeat customers divided by the total number of customers.
A CRM dashboard helps businesses know where they stand against their company’s goals and objectives so that they develop and implement strategies to achieve those goals.
A CRM dashboard provides insights on future opportunities or market changes aligned to your business objectives using real-time data for better accurate predictions.
The one-view data visualization in a CRM dashboard in easy-to-digest visual illustrations helps people spot business trends more quickly than traditional numerical spreadsheets and unstructured data or long reports.
CRM and marketing dashboards show where your target members are being influenced, allowing you to accurately put resources in the segments with the highest success potential, saving you money and time.
A CRM dashboard provides in-depth insights into your customer’s perception of your brand, allowing your salespeople to deliver faster, more personalized customer support, leading to higher customer satisfaction.
A SaaS dashboard provides a visual one-view of your key SaaS company’s overall performance. Garnered from; sales, marketing, finance, support, and development teams to give you an accurate, holistic view of your business workflow processes.
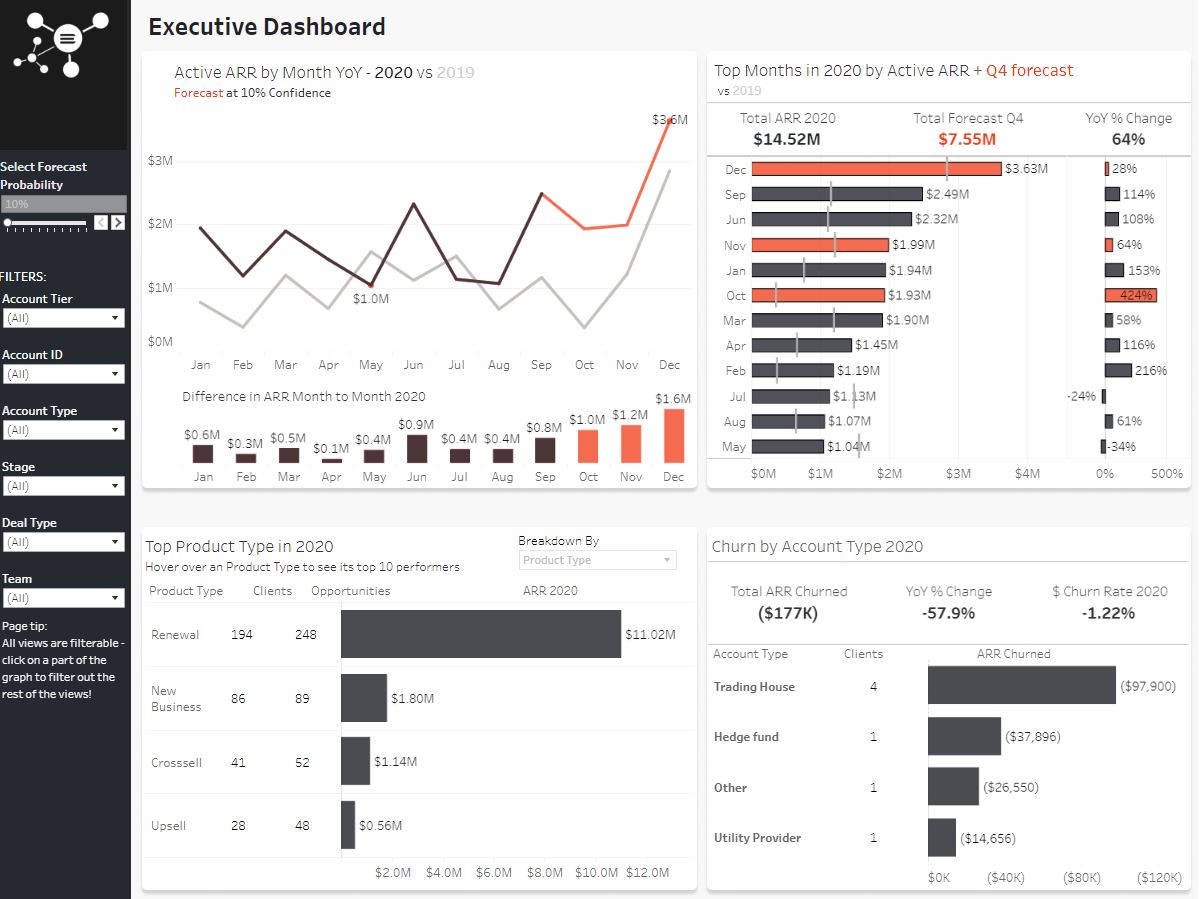
Full dashboard available on Tableau Server.
CAC is the amount that your business spends to acquire an individual customer. This data enables you to make strategic financial decisions toward improving your business’s overall operational efficiency. Particularly if you’re offering a subscription-based service.
It provides data on how much you stand to earn from your average customer during your relationship with them. This enables you to predict how much value a customer will likely offer. Ultimately, allowing you to distribute your resources efficiently.
The average revenue per unit metric offers insights into your average customer’s value from your combined sales over a set timeframe. Access to this valuable information enables businesses to understand the factors limiting their ARPU so that they are able to formulate appropriate strategies to get better ARPU.
Provides you with a glimpse of your business’s monthly recurring revenue for optimum results.
It provides insights into why a customer stopped using the service during a specific time frame. This allows you to come up with appropriate customer retention strategies. The churn rate is calculated by dividing the total number of customers you had at the beginning of the month by the total number of customers lost during that period. A churn only happens when a customer closes an account or cancels a subscription that has already generated revenues for your business.
A fintech or financial dashboard is a business intelligence tool that visualizes, tracks, and reports on financial KPIs. Such as the working capital ratio, return on assets, return on equity, and debt-equity ratio, among others.
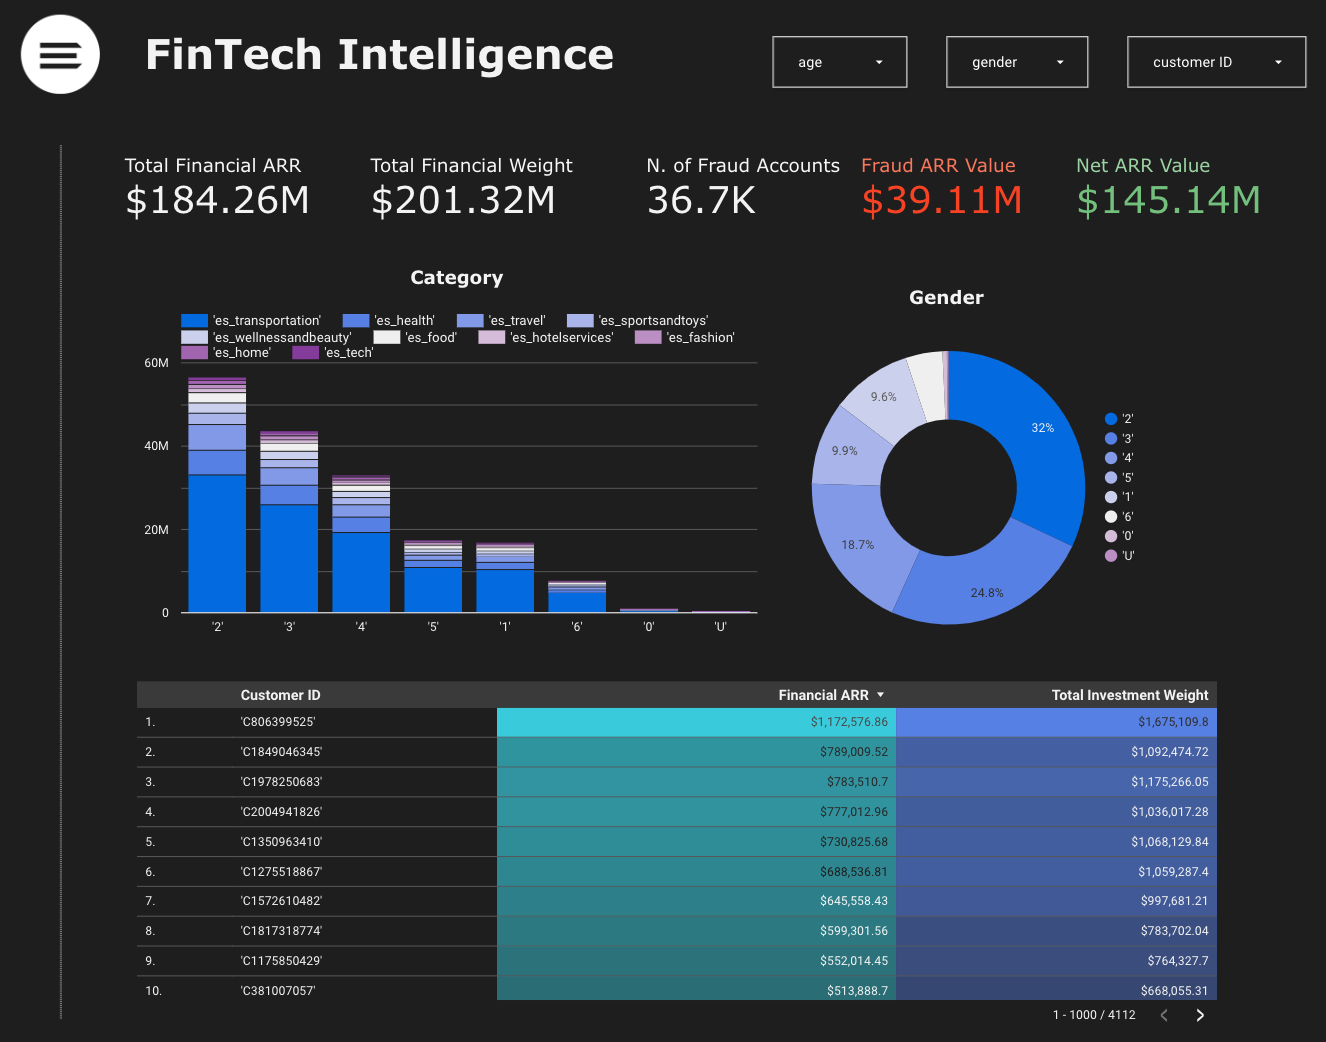
Full dashboard available on Looker Studio.
It provides businesses with data on how long it takes their users to complete specific actions; set up direct deposit, buy stocks, bank online, etc. Businesses can then use this information to optimize their processes, improving their app user experience.
This metric gives you the number of your app’s active users per month, which is a good period to understand better how engaged your fintech users are.
The ability to calculate the cost of acquiring each new customer is critical. The cost of your user is intertwined with the success of your app user acquisition strategy.
The install-to-registration rate for fintech apps is generally high compared to other industries, and the insights garnered here are critical in formulating your app user acquisition strategy.
Monitoring users’ behavior is among the key metrics of fintech business dashboards. It provides businesses with insight into how their users engage with their systems, allowing them to optimize their financial products for them. This translates to increased revenues.
Financial products and services should be flexible and quick to adapt to the different financial needs of their target market. Fintech dashboards provide businesses with data on evolving market trends, enabling them to develop and implement relevant financial products and services for their target markets.
Fintech business intelligence dashboards offer businesses a 360-degree understanding of their users’ interaction with their financial products and services. The data garnered by the fintech business intelligence dashboard informs how best to improve security and fraud detection. For example, BI analytics can track and identify suspicious patterns and uncover fraudulent activities on a compromised user’s account. ENGINE’s team comprises experienced marketing analysts, data scientists, and engineers, who together create world-class, customizable, custom-made customs for companies of all sizes. We only use trusted platforms such as; Fivetran, DBT, and Tableau for our data extraction, transformation, and visualization.
Our wide range of business intelligence dashboards is hugely dependent on machine learning technologies that enable our solutions to provide accurate, up-to-date information.
Are you looking for a business dashboard for effective tracking of your KPIs?
Click the button here to get in touch with ENGINE and learn how our world-class business intelligence and analytics dashboard can help move your business to the next level.
Business intelligence dashboards provide real-time data, streamline reporting, enable data-driven decisions, and enhance data sharing across departments. They also help in identifying workflow inefficiencies and maintaining a competitive edge.
By providing a single view of real-time data across departments, business dashboards allow for more informed and quicker decision-making, supported by accurate data.
KPIs such as Average Order Value, eCommerce Conversion Rate, Total Revenue by Channels, and User Sessions can be tracked, helping businesses optimize their performance and customer engagement.
CRM dashboards provide insights into sales activities, lead conversion ratios, marketing ROI, and customer satisfaction, helping teams make data-driven decisions and better align their strategies with business goals.
Yes, business dashboards can be customized to fit the specific needs of different industries, such as eCommerce, SaaS, and fintech, offering tailored KPIs and metrics relevant to each sector.
Business dashboards can integrate data from various sources, including databases, CRM systems, marketing platforms, financial systems, and third-party applications, allowing for a comprehensive view of business operations.
The frequency of data updates depends on the specific setup but can range from real-time updates to daily or weekly refreshes, ensuring that the information is always current and actionable.
While business dashboards are designed to be user-friendly, some initial training might be beneficial to help users understand the full capabilities of the dashboard and how to interpret the data accurately.
