What’s an eCommerce Dashboard?
An eCommerce dashboard is a real-time user or visual interface that displays and monitors a set of metrics and key performance indicators (KPIs) related metrics such as; sales, revenue, products, and many more
Among the eCommerce trends is having an eCommerce dashboard. It provides your eCommerce team with analytics that give more profound insights into your core financial and eCommerce KPIs and Key Performance Indicators.
Keeping a close eye on your eCommerce data allows you to garner eCommerce insights, which you can use to better your online store customers’ experience and set up an effective eCommerce strategy. A dropshipping dashboard is an excellent example of an eCommerce dashboard.
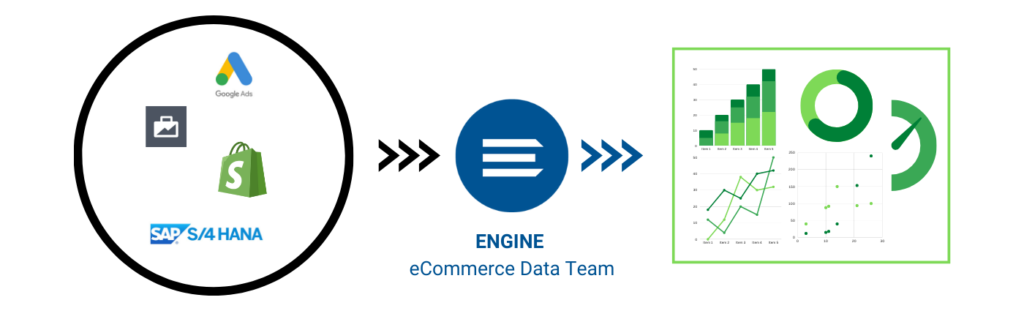
**The above video is showcasing an ENGINE eCommerce tableau dashboard built through the extraction, transformation, and loading of the following data sources: Google Ads Paid Search, Facebook Ads Manager, Shopify and SAP S/4 Hana
Find out more about Business Intelligence and how our Team can build automated data pipelines and create beautiful Tableau business dashboards for your company.
eCommerce Metrics and KPIs For Your Dashboard
There are dozens of eCommerce Metrics and KPIs that eCommerce businesses can choose from to keep track of their eCommerce performance. Are you looking to meet your eCommerce goals?
Below are the core eCommerce metrics and KPIs that eCommerce dashboards should have in order to meet your main eCommerce goals.
Revenues:Â
Includes specific revenue preferences, shipping, and taxes, expressed in both Gross and Net.
Lifetime Value (LTV):
Revenue generated by a customer to the business over the entire business relationship period
Profit Margins:
The percentage amount you make after subtracting your expenses.
Refunds:
It helps identify problematic products
Average Order Value (AOV):
The average amount of money a customer spends per transaction
Customer Acquisition Cost (CAC):
Amount of money an Ecommerce store spends to acquire a customer
Return On Ad Spend (ROAS):
Percent of return an online business generates in relation to the amount spent on promoting the product or service.
Bounce Rate:
Percentage of visitors who leave a website without viewing the second page.
Conversion Rate:
Percentage of visits to your online store that end up purchasing an item.
Cart Abandonment Rate:
Percentage of visitors to your eCommerce site who add items to their shopping cart but leave your online store without purchasing them.
Benefits of an eCommerce Dashboard
Easy to Interpret
eCommerce reporting is made easy by the use of eCommerce Sales Dashboards. They are easy to interpret, unlike other business intelligence methods such as reports and spreadsheets. They streamline complex eCommerce data by translating them into visual formats that are easy to interpret.
It Saves Time (and money!)
eCommerce dashboards simplify the process of obtaining eCommerce Analytics by reducing the number of data sources (Shopify, Google Analytics) used for gathering eCommerce insights and presenting your eCommerce data on a single panel.
Increase in Revenue
Do you want to increase your eCommerce sales? Easily accessing your eCommerce data in real-time gives you the insights to develop and implement better sales and acquisition strategies that lower your acquisition cost, translating to higher revenue for your online store.
Motivates Team
When work teams can easily view their performance on set targets, revenue, conversions, etc., they are motivated to reach their goals. Work teams can even compete against each other in the competition, effectively raising the bar on productivity within the company.
Accurate Reporting
Accurate eCommerce reporting is a critical factor in growing your online business. An eCommerce dashboard provides you with real-time eCommerce data insights that can be used for accurate forecasting.
Create Your eCommerce Dashboard with ENGINE’s Team of Data Experts
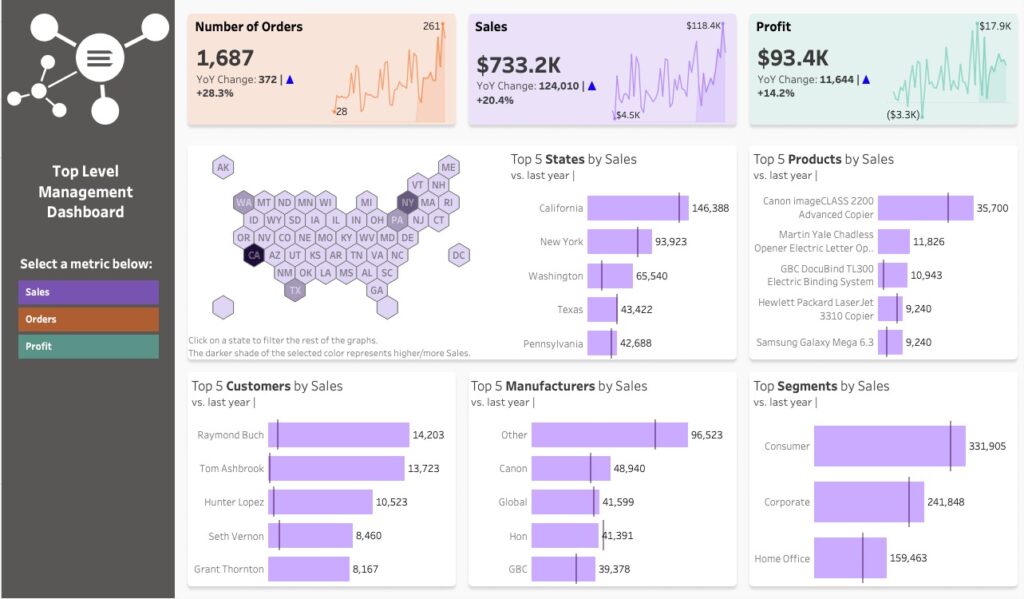
Creating your own customized eCommerce dashboard templates based on your preferred reporting is highly recommended, allowing you to view only the insights that matter most to your online store or business.
ENGINE creates automated multichannel eCommerce dashboards that provide comprehensive eCommerce tracking in a single unified panel of products, customers, promotions, inventory, and much more.
Get in touch with our team today and learn how ENGINE Analytics can help your business grow.