Trying to pick between QuickSight, Looker, and Power BI? You’re not alone. The QuickSight vs. Looker vs. Power BI debate is one every data-driven business ends up having at some point. Each tool has its own strengths, weaknesses, and quirks—kind of like trying to choose between a sports car, an SUV, and a hybrid. It all depends on where you’re going and how you like to drive.
In this guide, we’ll break down each tool from a human perspective—no technical jargon overload. Whether you’re a startup, an enterprise, or somewhere in between, this guide will help you figure out which one is your perfect dashboard match.
Why Compare QuickSight vs. Looker vs. Power BI?
Dashboards are more than just charts—they’re your business’s visual pulse. The right dashboard tool helps you make smarter decisions, faster. But with dozens of options out there, QuickSight vs. Looker vs. Power BI emerges as the most common and practical comparison for modern teams. These three dominate the business intelligence (BI) market, but they’re not built the same.
Let’s dive in and unpack what makes each one shine—or stumble.
Amazon QuickSight: The Cloud-First Contender
What Is QuickSight?
QuickSight is Amazon Web Services’ (AWS) answer to business intelligence. It’s fully cloud-native, scalable, and known for its pay-per-session pricing model. Basically, it’s like a food truck for data—you pay only when you stop by.
Pros of QuickSight
Serverless & Scalable: You never have to manage infrastructure.
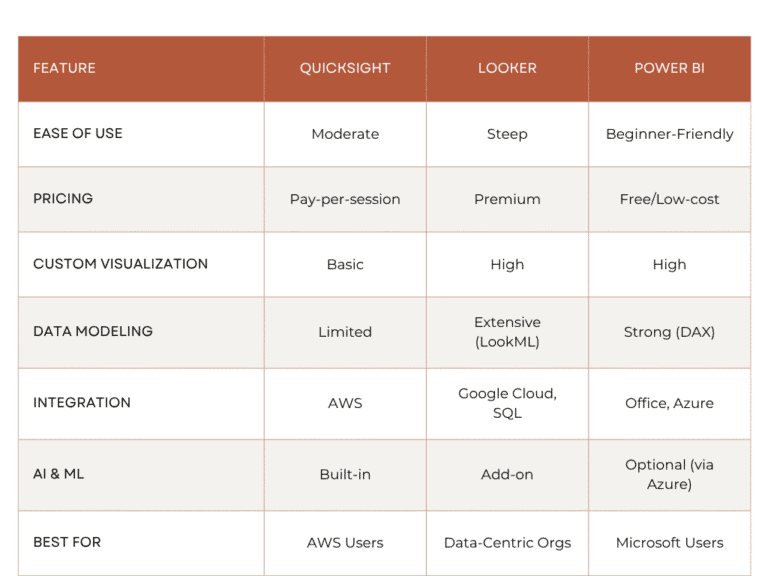
Integration with AWS: Seamless if you’re already in the AWS ecosystem.
Machine Learning Insights: Built-in ML tools for forecasting and anomaly detection.
Affordable: Especially for teams that don’t need daily access.
Cons of QuickSight
UI Could Be Better: Let’s just say it’s not winning design awards.
Limited Customization: Not ideal for ultra-specific data storytelling.
Best For:
Small to medium businesses using AWS, or anyone wanting quick, scalable, cost-effective reporting.
Google Looker: The Data Model Powerhouse
What Is Looker?
Looker, part of the Google Cloud family, is not your average dashboard tool. It’s all about modeling your data with LookML (its own query language) and serving it up clean and consistent across the organization.
Pros of Looker
Centralized Data Modeling: Ensures everyone sees the same version of the truth.
Flexible & Extensible: Works beautifully with SQL databases.
Custom Apps: You can build tailored data experiences.
Great for Embedded Analytics: Add dashboards right into your own apps.
Cons of Looker
Steep Learning Curve: LookML isn’t everyone’s cup of tea.
Pricey: Especially for smaller teams or startups.
Not Ideal for Ad-Hoc Users: It’s more of a power-user tool.
Best For:
Enterprises with complex data needs, data teams that love structure, and companies looking to build custom data applications.
Microsoft Power BI: The Office Favorite
What Is Power BI?
Power BI is Microsoft’s golden child for data visualization. It’s tightly integrated with Excel, Office 365, and Azure, making it the natural pick for many enterprise environments.
Pros of Power BI
Familiar Interface: Excel users feel right at home.
Rich Visuals & Customization: Tons of charts, slicers, and add-ons.
Affordable: Very generous free tier and low-cost Pro version.
Strong Community: Thousands of templates, forums, and support articles.
Cons of Power BI
Can Be Clunky at Scale: Performance may dip with very large datasets.
Limited in Mac Environments: Microsoft… enough said.
DAX Learning Curve: Their formula language isn’t intuitive for beginners.
Best For:
Mid-to-large teams using Microsoft tools or anyone needing advanced visuals without breaking the bank.
QuickSight vs. Looker vs. Power BI: Feature Comparison
Use Case Scenarios: Which Tool Fits Your Needs?
For Startups and Small Teams
If you’re small and nimble, QuickSight’s pay-as-you-go model can save you serious cash. You don’t have to commit to huge licensing costs, and it scales with you.
For Data-Driven Enterprises
Looker shines when you’ve got a team of analysts and engineers who care about data governance and consistency. It’s like a data librarian—it keeps everything organized and standardized.
For Non-Tech Business Teams
Power BI is super approachable for business users. If your team already lives in Excel or Teams, this is a no-brainer. You can build your first dashboard in an afternoon.
QuickSight vs. Looker vs. Power BI: Pricing Breakdown
QuickSight
Standard: $9/user/month
Enterprise: $18/user/month
Pay-per-session: ~$0.30/session
Looker
Custom pricing (usually starts around $5,000/month)
Depends on users and scale
Power BI
Free: Desktop version
Pro: $10/user/month
Premium: From $20/user/month (or $4,995/month per capacity)
What About Real-Time Dashboards?
If you need up-to-the-minute data, QuickSight vs. Looker vs. Power BI becomes a question of architecture.
QuickSight integrates with Amazon Kinesis for real-time streams.
Power BI can connect to streaming datasets and Azure services.
Looker favors scheduled data refreshes unless customized.
In short: Power BI and QuickSight are better suited for real-time dashboards out of the box.
Customization & Visual Design
Want dashboards that wow?
Power BI gives you maximum visual control—great for presenting to execs.
Looker lets you build custom data apps, but it’s not always as flashy out of the box.
QuickSight is more functional than fancy—gets the job done, but lacks sizzle.
Security & Compliance
If you’re in a regulated industry, security isn’t optional.
QuickSight leverages AWS-grade security.
Looker supports fine-grained data control and SSO integration.
Power BI uses Microsoft’s enterprise-grade security framework and is compliant with most industry standards.
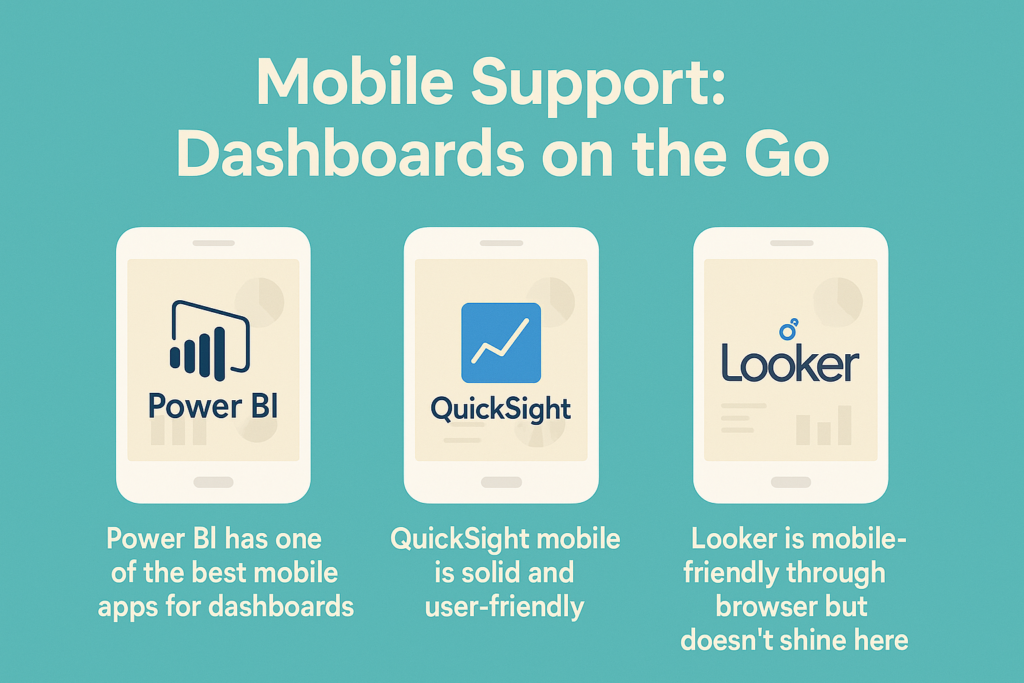
Mobile Support: Dashboards on the Go
Power BI has one of the best mobile apps for dashboards.
QuickSight mobile is solid and user-friendly.
Looker is mobile-friendly through browser but doesn’t shine here.
Collaboration Features
Collaboration isn’t just about sharing a link.
Power BI has deep integration with Teams, SharePoint, and Excel.
Looker supports data actions and embedding in tools like Slack.
QuickSight allows dashboard sharing and comment threads but is more limited.
Learning Curve: How Fast Can You Get Started?
If you’re not a data scientist, ease matters.
QuickSight is relatively simple but takes time to fully master.
Looker requires a solid grasp of SQL and LookML.
Power BI is easiest to adopt, especially for Excel pros.
Community and Ecosystem
A strong community can make or break your onboarding.
Power BI has a massive global community and thousands of plugins.
Looker’s community is growing, especially among Google Cloud users.
QuickSight’s community is smaller but getting stronger as AWS pushes forward.
Conclusion
There’s no single winner here—and that’s actually good news.
Go with QuickSight if you’re a lean AWS shop looking for affordable scale.
Choose Looker if you’re building a long-term data strategy with modeling and governance.
Pick Power BI if you want a powerful, affordable, and user-friendly dashboard tool.
It’s all about what fits your tech stack, team skills, and data goals. One size doesn’t fit all—so choose the one that wears best on your team.
Still unsure? At ENGINE Analytics we help teams like yours find and scale the right data tools – without the guesswork. Whether you’re building dashboards for the first time or optimizing analytics at scale, we’ve got your back.