
Table of Contents
Revenue Analytics Project Overview
Background
A well-known cyber law firm in the US was looking for a better system to understand and use the information in their database. They wanted to find new chances to help their clients more effectively. Their current database was good for putting in data and keeping records, but it wasn’t great at showing them the bigger picture, like trends and patterns in their work and sales numbers. We have then consulted them to set up a robust revenue analytics system.
Objectives
The main objectives were:
- Offer detailed insights into clients, departments, and processes in relation to revenue, job numbers, and pipeline.
- Develop a tool for the team that can be displayed on a central monitor in the office.
- Set up a notification system to inform senior management about any recent increases or decreases in revenue and job numbers.
Tech Stack
The technologies used in this project were the following:
- ServeManager
A database for storing entry data, equipped with an API for extracting data.
- Google Cloud Platform
A cloud system for enhanced storage capabilities and automation features.
- Cloud Functions
Tools for automating the daily transfer of data from one point to another.
- Google BigQuery
A data warehouse used for storing and processing data.
- Looker
A tool for data visualization, highlighting trends and patterns
Data Collection and Processing
Data Sources
The primary data source was ServeManager, a specialized software database designed for firms working in the court and legal industry.
Data Processing
We set up the data flow to connect with ServeManager using a REST API, managed through a custom-built Python script. We automated the script using GitHub for code management and Cloud Functions to trigger the script daily. The data was then saved in Google BigQuery, where we did further modeling to organize and clean the data for reporting. Finally, we connected the cleaned dataset to Looker for visualization.
Results and Analysis
Findings
The implementation of revenue analytics through our integration of advanced technologies from Google Cloud Platform and ServeManager’s robust database significantly transformed the law firm’s approach to data insight. Using BigQuery for deeper analysis allowed us to uncover vital patterns in revenue streams and job efficiency that were previously obscured by conventional data handling methods.
- Revenue Tracking: Real-time updates facilitated by revenue analytics tools enabled the firm to monitor fluctuations in revenue and job numbers accurately, helping identify both successful strategies and areas needing improvement swiftly.
- Client Engagement: Enhanced revenue analytics provided detailed insights into client interactions and departmental performances, enabling the firm to optimize operations based on specific client needs and prevailing legal trends.
Visualizations
Looker’s role in visualizing revenue analytics was crucial in turning raw data into actionable insights. These visualizations included:
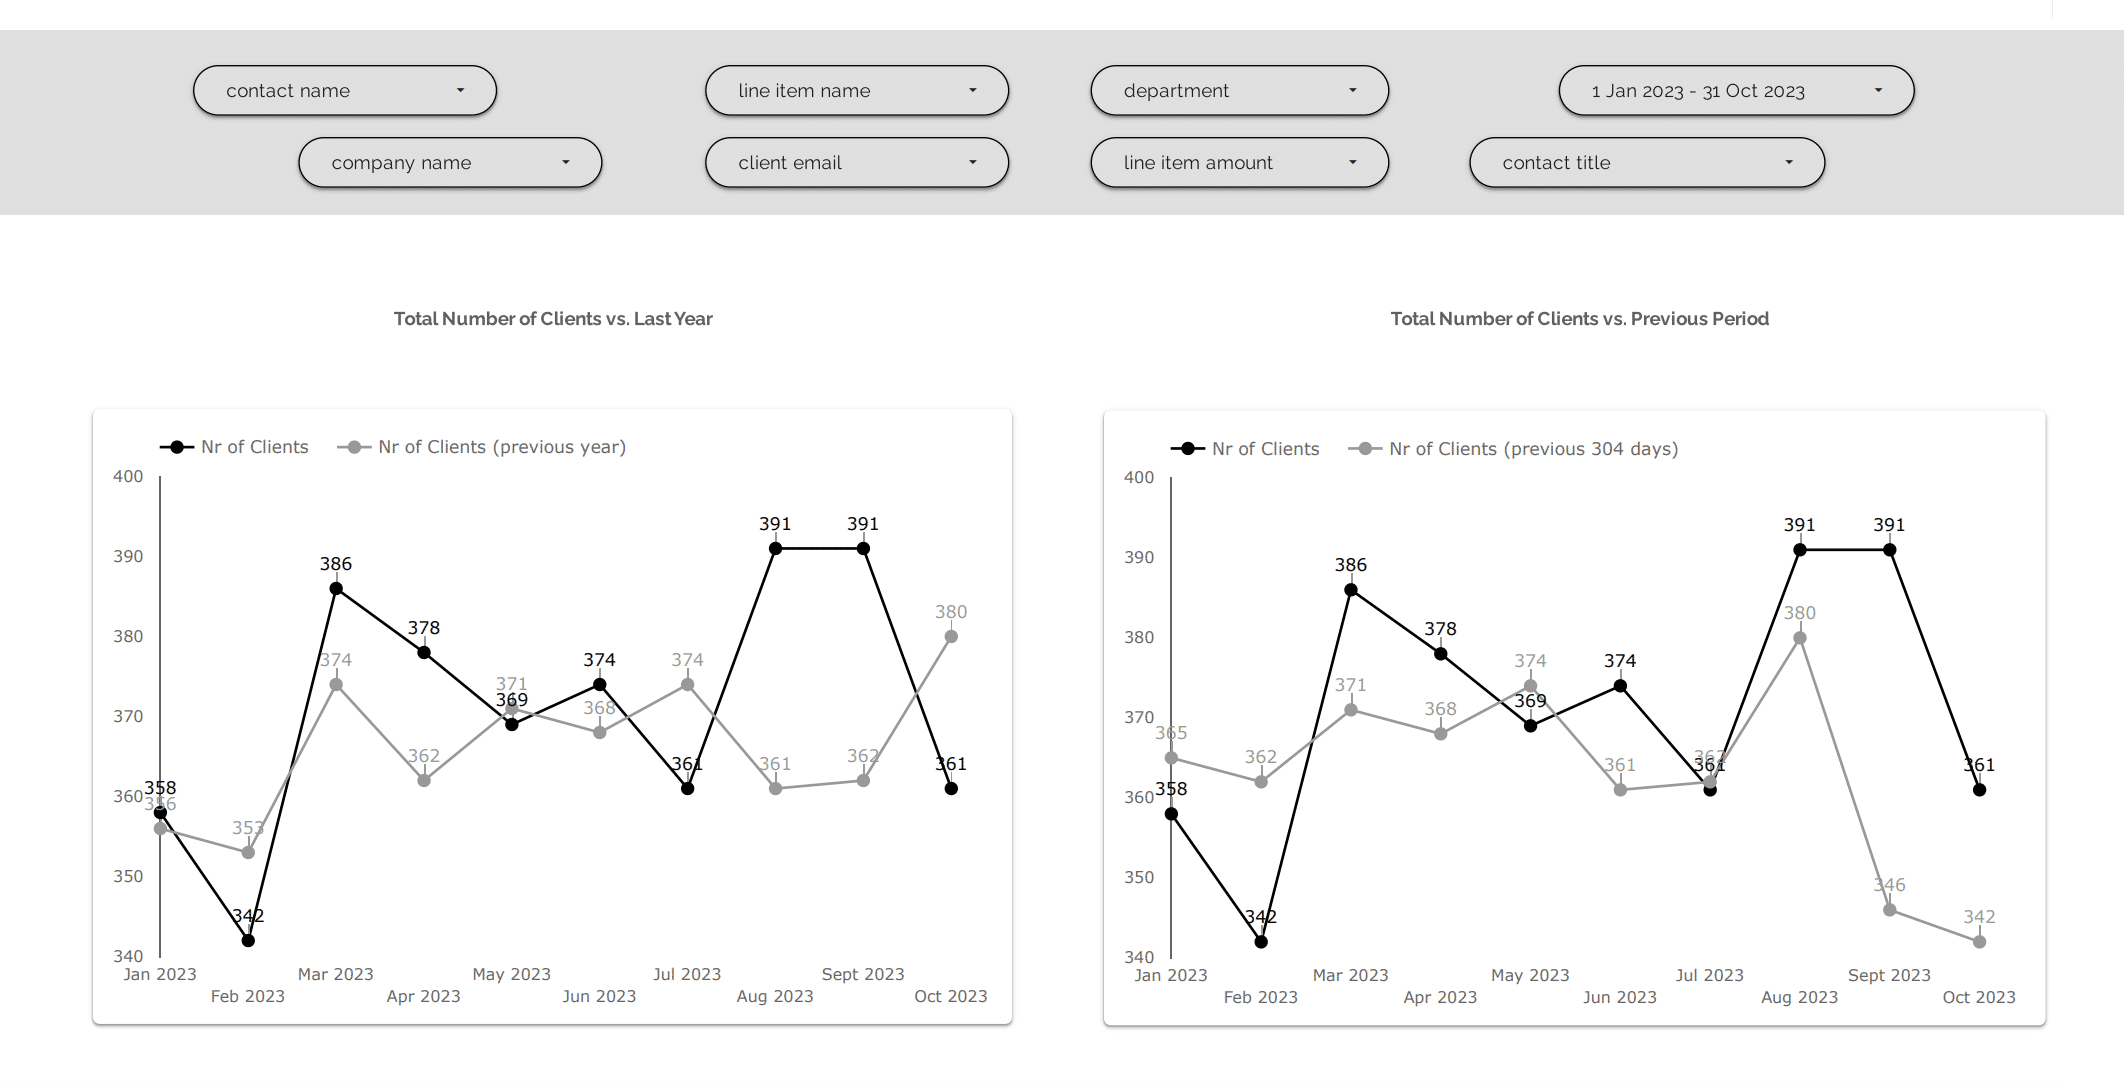
- Dashboard Overviews: Custom dashboards focused on key revenue analytics metrics such as current revenue, job status, and pipeline projections, enabling quick, data-driven decision-making.
- Trend Analysis: Graphs and charts highlighted ongoing trends in revenue and departmental performances, offering a visual narrative of the firm’s operational effectiveness over time.
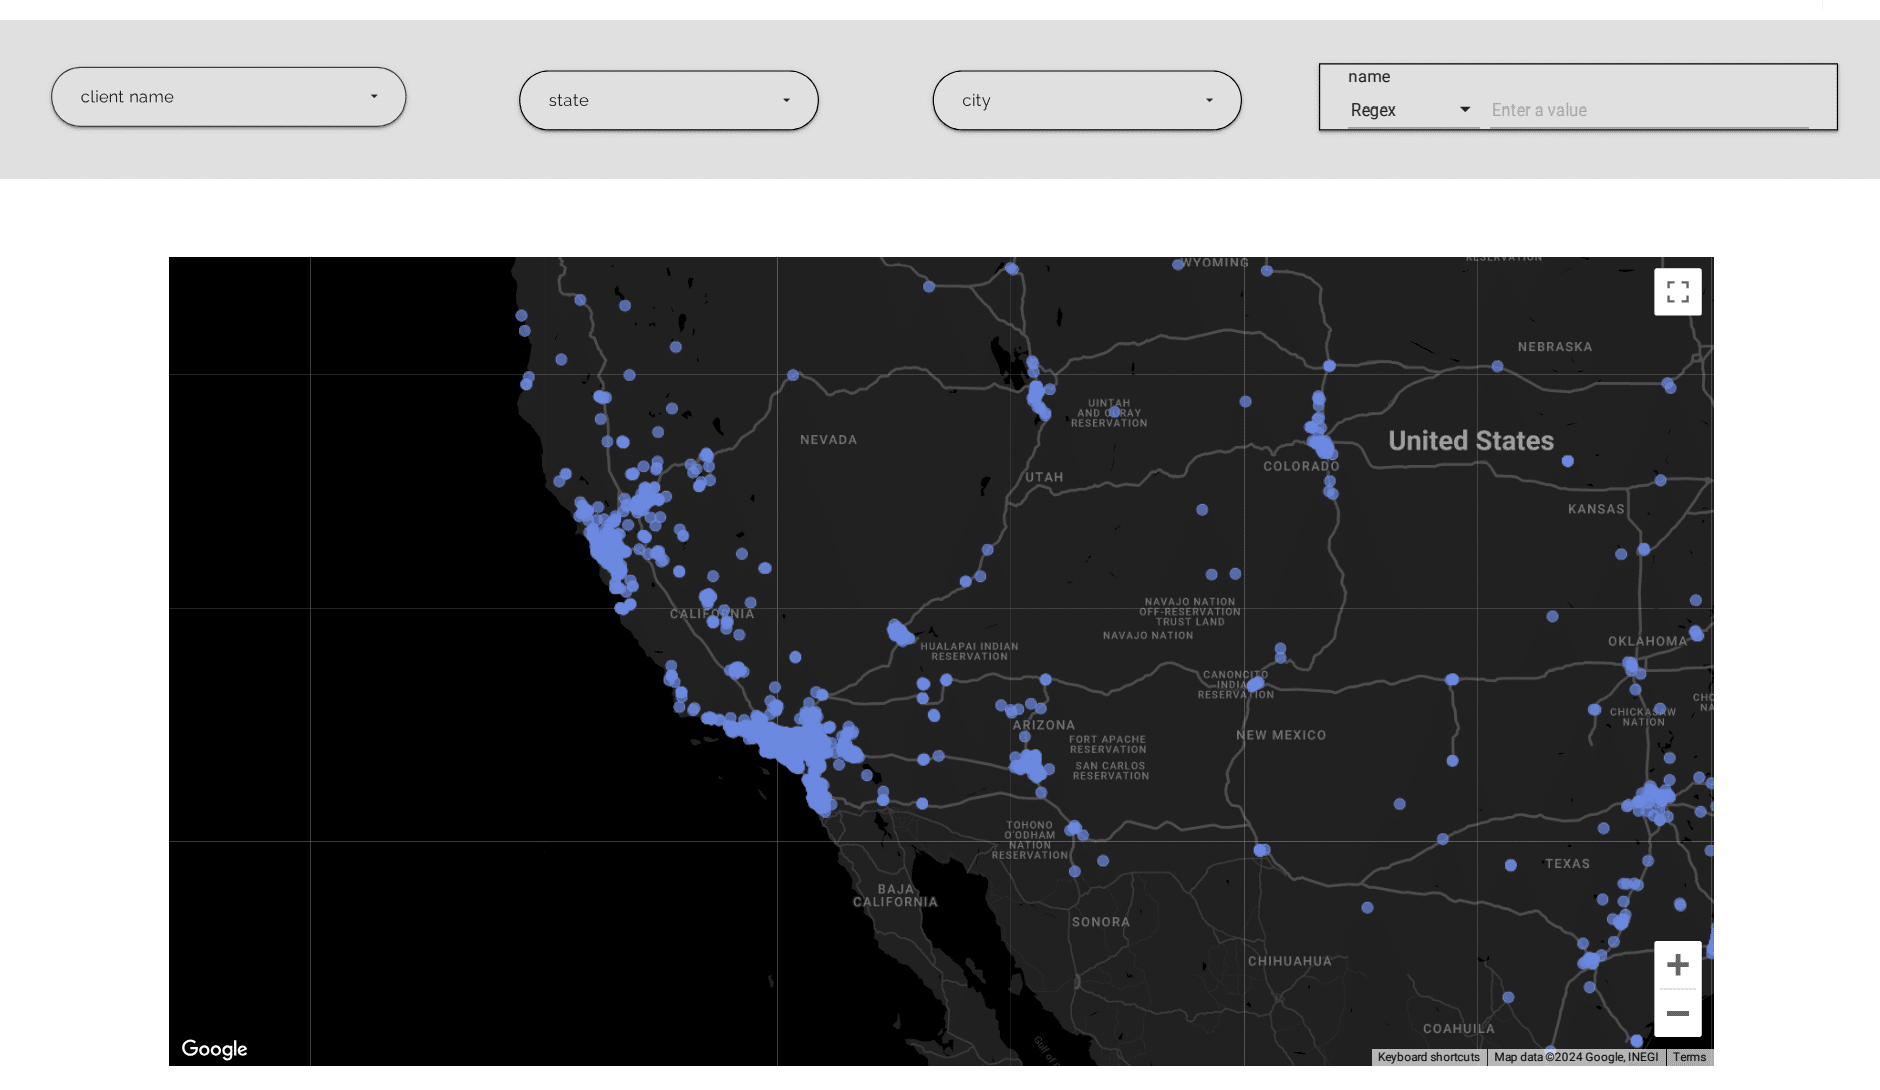
- GeoMap Analysis: GeoMaps integrated with Google Maps provided spatial analysis, showing where clients were located alongside corresponding revenue data and route planning for client visits.
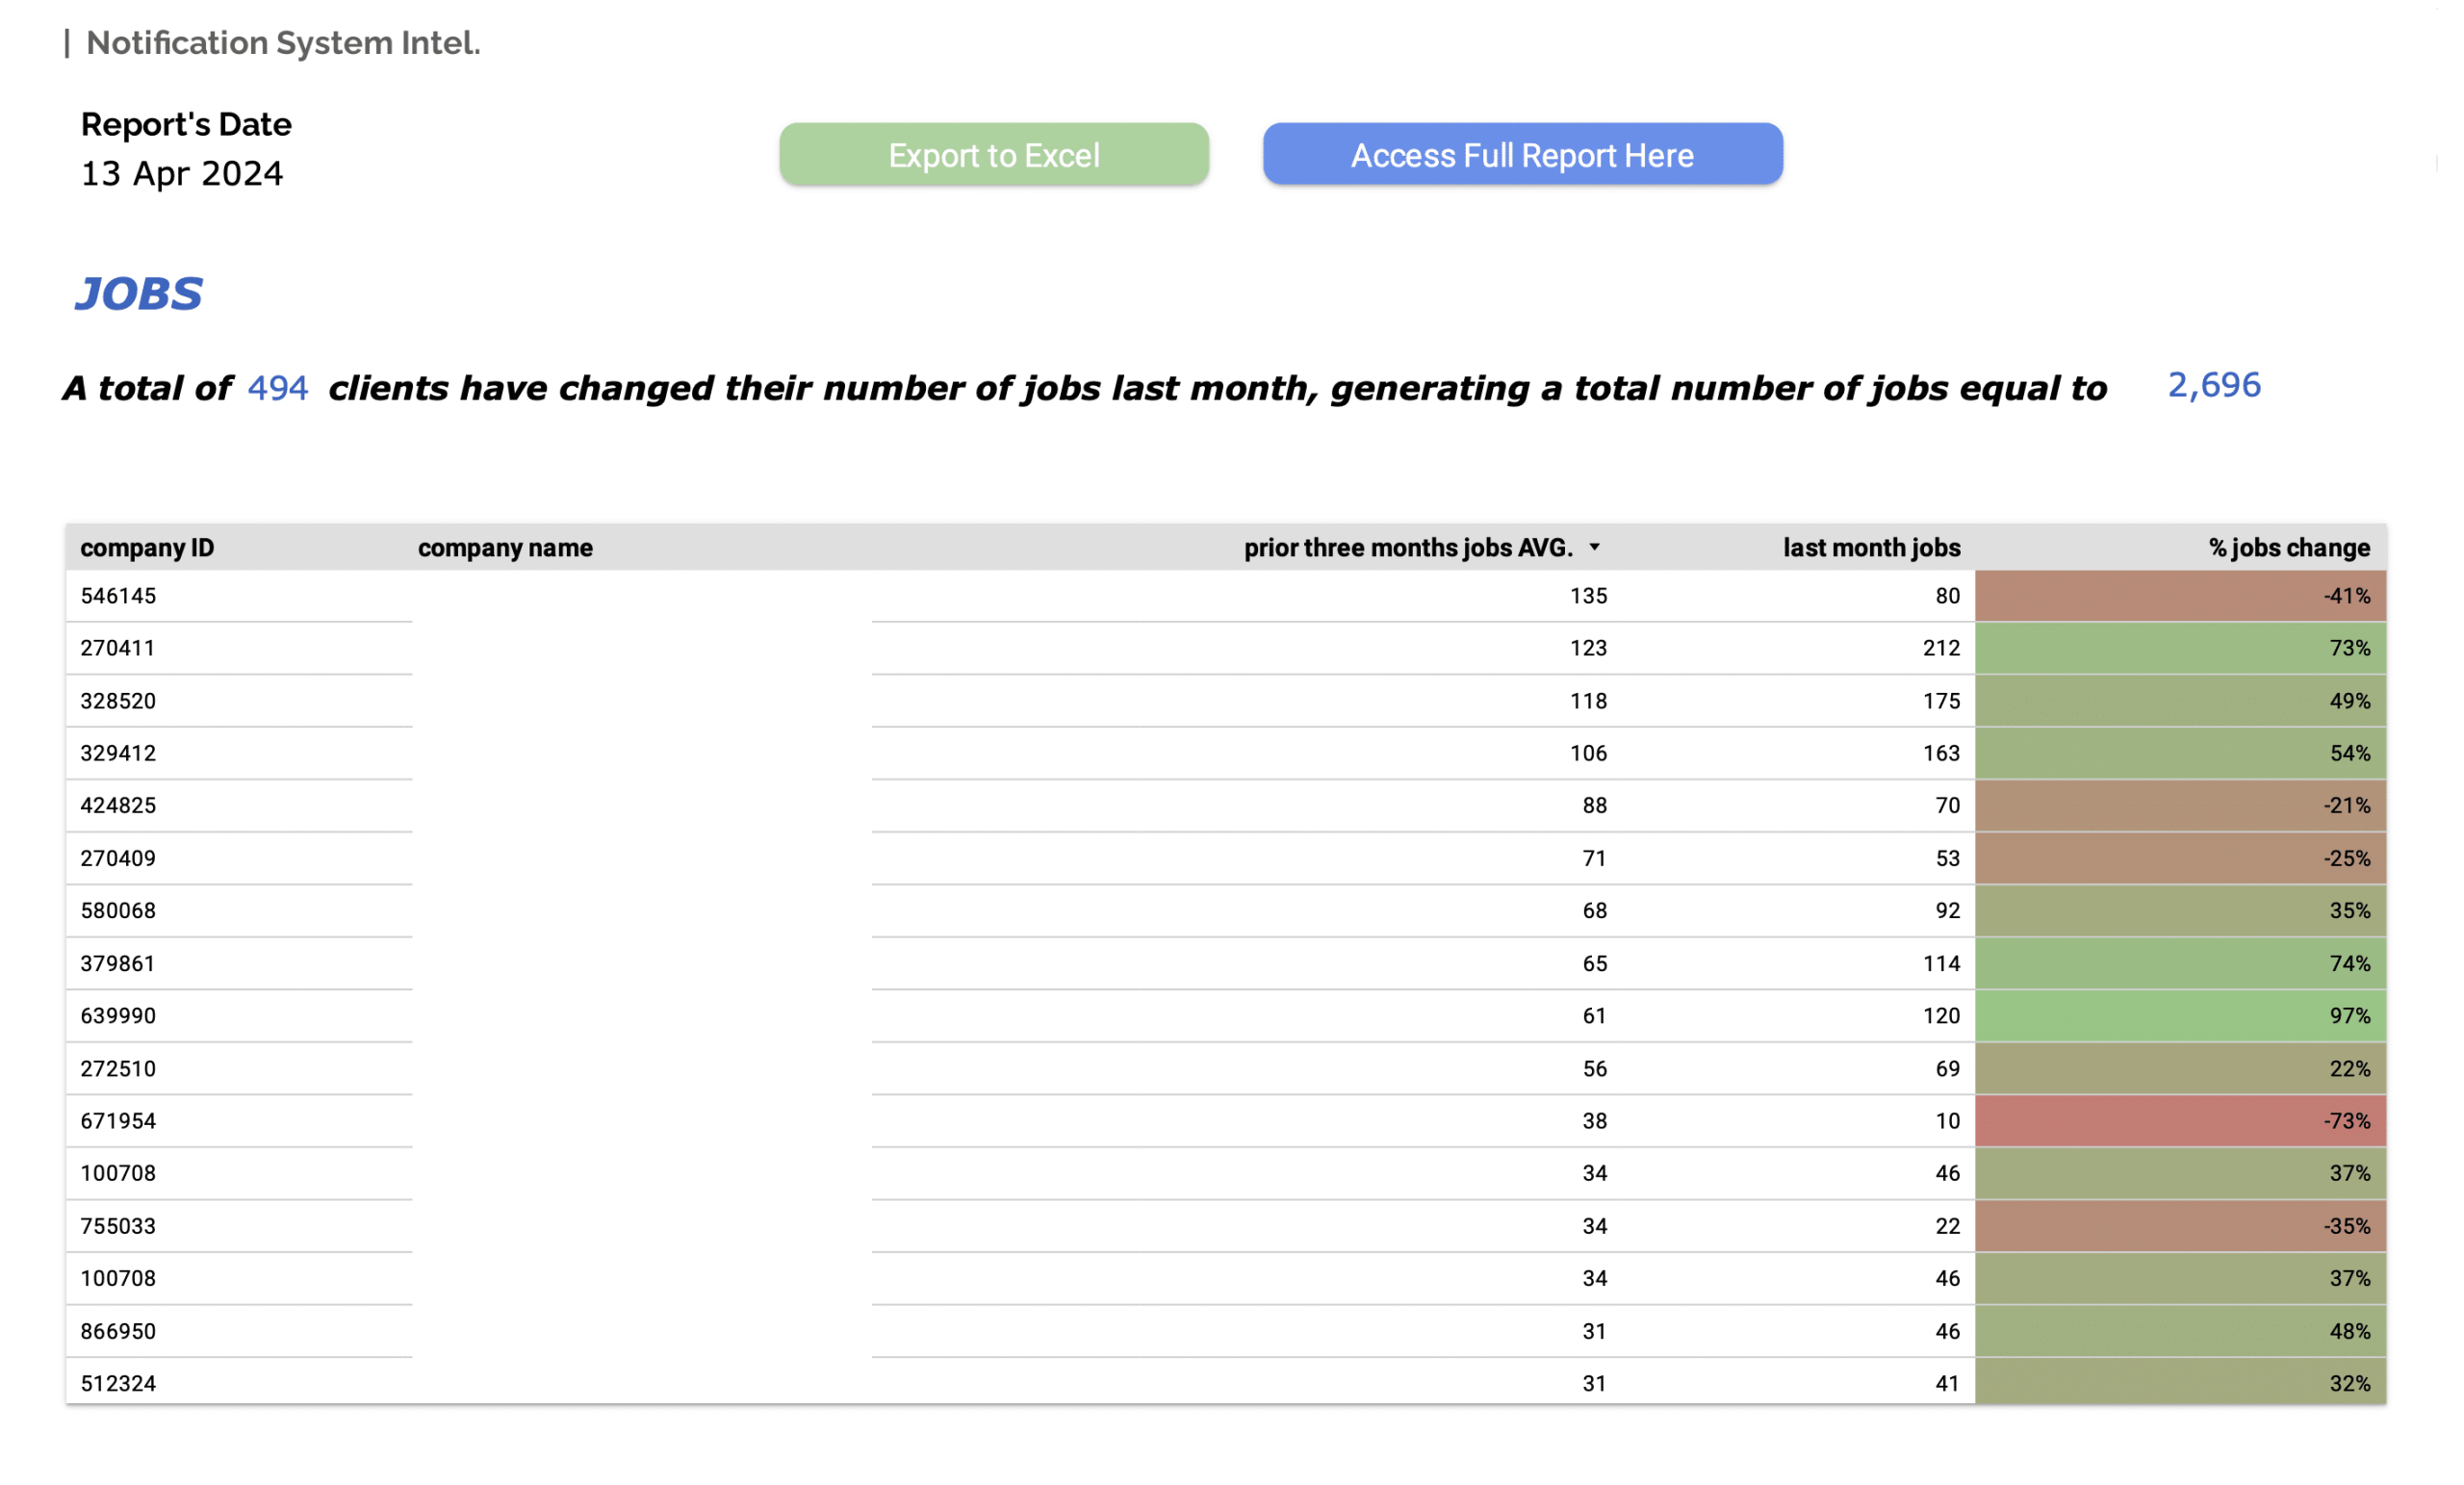
- Notification System Visuals: The visualization tools also incorporated alerts from the notification system, which automatically sent emails to senior management listing clients who had notable increases or decreases in jobs and revenue over the last month.
Revenue Analytics Page
Notification System Page
Geo Map Page (via Google Maps API)
Implementation and Impact of Revenue Analytics
Applications
The new system significantly enhanced several aspects of the firm’s operations through focused applications of revenue analytics:
- Operational Efficiency: Automated data flows and alerts from our revenue analytics system reduced manual data handling, allowing staff to concentrate on higher-value tasks and implement better business development strategies.
- Strategic Decision Making: Real-time data and predictive insights from revenue analytics enabled management to make informed strategic decisions, enhancing overall business responsiveness.
Outcomes
The impact of integrating a dedicated revenue analytics system was substantial:
- Increased Revenue: Optimized client services and better resource allocation driven by detailed revenue analytics directly boosted revenue.
- Client Retention and Acquisition: Improved insights into client needs and trends through sophisticated revenue analytics improved client retention rates and attracted new clients through targeted strategies.
By leveraging state-of-the-art technology to refine their data processes and insights, the law firm not only enhanced its operational capabilities but also reinforced its position as a forward-thinking leader in the legal industry, thanks to the strategic application of this automated revenue analytics system.
Frequently Asked Questions (FAQs)
What is the initial setup time for implementing a revenue analytics system like this?
The setup time can vary based on the existing infrastructure and the specific needs of the organization. Typically, it ranges from a few weeks to a few months to fully integrate all components and ensure they function seamlessly together.
How secure is the data throughout this revenue analytics process?
Security is a top priority. The system uses encrypted data storage and transfer protocols. Additionally, cloud platforms like Google Cloud Platform provide advanced security features that comply with industry standards to protect data integrity and confidentiality.
What is the cost associated with setting up and maintaining this revenue analytics system?
Costs can vary significantly based on the scale of deployment, chosen technologies, and specific customization needs. Expenses include software licensing fees, cloud storage and processing services, and consultancy fees for initial setup and ongoing maintenance. Ball park ranges are;
Initial Setup and Implementation: : $5,000 – $10,000
Monthly Ongoing Costs: $500- $2,000
Can the system be integrated with other types of data analytics tools?
Yes, the system is designed with flexibility in mind and can integrate with various other analytics and business intelligence tools. This allows organizations to leverage broader data insights and enhance their analytical capabilities.
What training is required for staff to effectively use this revenue analytics system?
Training requirements depend on the complexity of the system and the technical proficiency of the users. Typically, training sessions would cover how to use the database, understand dashboard metrics, use the notification system, and interpret data visualizations effectively.
How customizable is the notification system? Can it be adjusted to specific user or department needs?
The notification system is highly customizable. Alerts can be configured based on specific thresholds, types of data changes, or particular time frames. This customization ensures that different departments or users receive relevant and timely information.
Are there any scalability considerations for growing firms or expanding the system's capabilities?
The system is scalable to accommodate growing amounts of data and additional functionalities. Cloud-based solutions like Google Cloud Platform are particularly suited for scalability, allowing firms to increase storage and processing capabilities as needed.
How does the system handle data inaccuracies or anomalies?
Every data engineering system that we implement includes features for data cleansing and anomaly detection to ensure high data quality. Automated scripts and machine learning models can be implemented to identify and rectify data inaccuracies or outliers before they affect the analysis.
Why Partner with a Data Analytics Company like ENGINE
ENGINE’s team comprises experienced marketing analysts, data scientists, and engineers. We create world-class, customizable, custom-made customs for companies of all sizes. We only use trusted platforms such as; Fivetran, DBT, and Tableau for our data extraction, transformation, and visualization. Contact us to know more about out tech stack!
Our wide range of business intelligence dashboards is hugely dependent on machine learning technologies. This enables our solutions to provide accurate, up-to-date information.
Are you looking to centralize your data and create awesome kick-ass business dashboards to track performance?
Click the button to get in touch with out Team!