Table of Contents
In today’s fast-paced digital world, data is everywhere. But here’s the catch — data alone doesn’t drive results. Action does. That’s why building dashboards that drive action is more important than ever. At Engine Analytics, we believe dashboards shouldn’t just display information—they should empower smarter, faster business decisions.
Let’s dive into how you can build dashboards that don’t just sit pretty, but actually spark insight and action.

Why Dashboards Matter More Than Ever
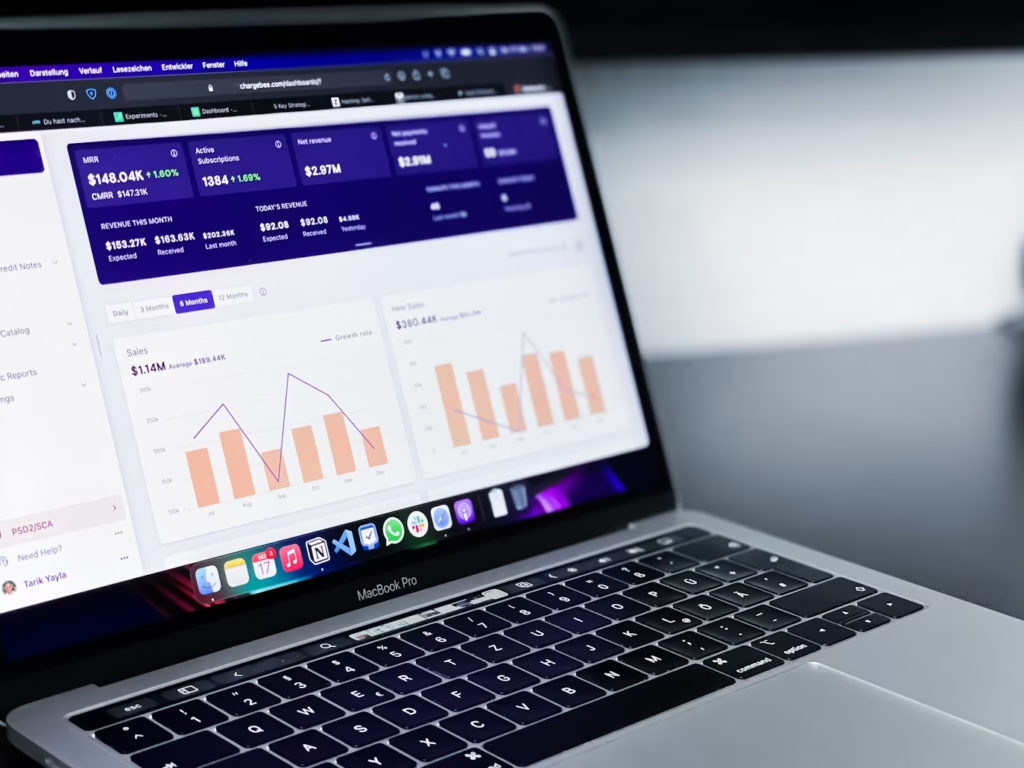
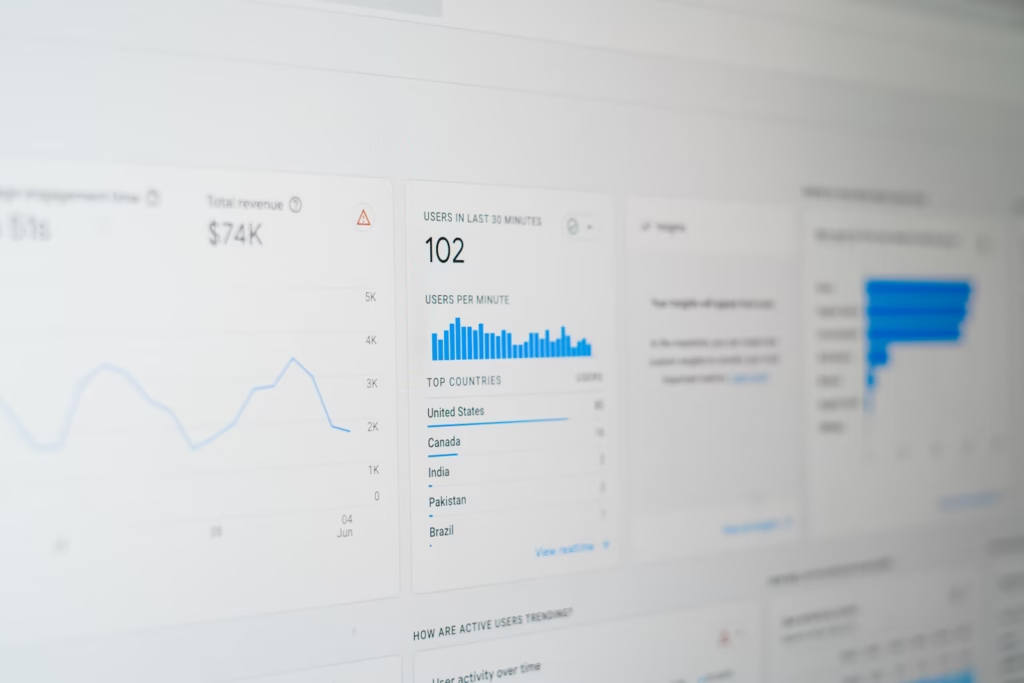
In a world where businesses are flooded with metrics—sales data, customer feedback, web traffic, you name it—dashboards serve as the control panel. They pull together key performance indicators (KPIs), analytics, and business-critical information into one clean interface. Think of it like a digital command center.
But here’s the thing: not all dashboards are created equal.
A truly building Dashboards doesn’t just present data—it tells a story, highlights what matters, and suggests what to do next. It’s like going from a static weather report to an interactive app that not only tells you it’s going to rain, but also suggests what time to leave the house to avoid it.
A Brief History of Dashboards (and Why It Still Matters)
The word “dashboard” originally came from the world of transportation. In cars and aircraft, building Dashboards helped drivers and pilots keep track of critical controls at a glance. Fast forward to the 1970s, when decision support systems adapted the concept for business. Since then, building dashboards have evolved to include real-time data, interactive elements, and visual storytelling.
In today’s data-heavy business environment, well-designed dashboards help organizations stay agile, competitive, and informed.
Different Types of Dashboards—and When to Use Them
Let’s break it down. There are four major types of dashboards, and each one serves a different purpose:
1. Operational Dashboards
These are your real-time dashboard. They’re updated constantly and help teams monitor day-to-day performance. You’ll see them used in sales, customer service, marketing campaigns, and logistics.
Example metrics: website uptime, order processing time, social engagement rates.
2. Strategic Dashboards
Built for the C-suite, strategic dashboard give high-level overviews of business health. They’re less about the minute-by-minute and more about long-term trends.
Example metrics: revenue growth, market share, profit margins.
3. Analytical Dashboards
These dig deep. They’re used to uncover patterns, predict outcomes, and evaluate what’s really going on beneath the surface.
Example metrics: customer churn trends, product usage patterns, user behavior segments.
4. Tactical Dashboards
Tactical dashboards are the bridge between strategy and daily ops. Think project tracking and departmental performance. Perfect for middle management keeping an eye on execution.
Example metrics: campaign results, milestones completed, weekly KPIs.

How to Build Dashboards That Drive Action
1. Start with the “Why”
Before building dashboards anything, ask: What decision should this dashboard help someone make?
If you don’t know the purpose, it’s easy to fall into the trap of visual overload. Every chart and stat should earn its place by supporting a decision or highlighting an opportunity.
2. Understand the User
Not every stakeholder is a data scientist. Your dashboard should match the needs and knowledge level of its user. A marketing manager and a CFO need different data, in different formats, and with different visual styles.
Want a dashboard people actually use? Design it for them, not for you.
3. Choose the Right Data (and Skip the Fluff)
More data doesn’t mean more insight. Focus on quality over quantity. What are the KPIs that truly reflect performance?
Pro tip: Ask the team, “If you could only track three metrics this quarter, what would they be?” That usually reveals the essentials.
4. Tell a Clear Story
When building dashboards, it’s important to guide the viewer, like chapters in a book. Use structure, logical flow, and intuitive layout.
Start with summaries. Allow users to drill down into detail if needed. Use consistent formatting. And for the love of clarity—don’t overwhelm with color or clutter.
Remember Minard’s visualization of Napoleon’s 1812 march? It told a complex story with simplicity and elegance. Your dashboard should aim to do the same.
5. Design for Interaction
The best dashboards aren’t static. Give users the power to explore, filter, and zoom into specific timeframes or data sets. This way, they can find answers that matter to their specific role or question.
6. Keep It On-Brand
This might sound minor, but visual consistency matters. Align your dashboard’s color scheme, fonts, and design style with your company’s branding. It adds professionalism and makes the experience more seamless for the user.
7. Test, Iterate, and Improve
Dashboards are never “one-and-done.” Roll out a beta version, get feedback, and tweak it based on real-world use. Ask your team:
- Is this dashboard answering your key questions?
- Is there anything confusing or missing?
- What else would help you take action faster?
Iteration is how good dashboards become great ones.

Actionable Dashboards in the Real World
Let’s say your ecommerce team launches a dashboard that tracks:
- Cart abandonment
- Live inventory
- Customer support ticket volume
Suddenly, they notice a spike in cart drop-offs tied to one product. Thanks to the actionable dashboard, they pause the item, check for bugs, and fix the issue—all within hours.
Without it? Those abandoned carts might’ve gone unnoticed for days.
That’s what separates a standard dashboard from an actionable dashboard: it empowers teams to act, not just observe.
Final Thoughts: Build Dashboards People Use
In the end, a dashboard is only as good as the decisions it helps you make.If you’re ready to start building dashboards that truly make a difference.
At Engine Analytics, we specialize in building dashboards that move the needle—whether you’re a startup founder trying to understand customer churn or a Fortune 500 exec tracking quarterly KPIs.
So if you’re tired of dashboards that just look pretty and don’t do much, maybe it’s time to rethink your approach.
Here’s Some Interesting FAQs for You
Why is real-time data so important for today’s dashboards?
Because business moves fast. Whether it’s a sudden spike in website traffic, a drop in inventory, or a shift in customer sentiment, having real-time data means you can act immediately. You’re not waiting for a weekly report—you’re seeing what’s happening right now. That kind of speed can make a big difference, especially when every minute counts. Real-time dashboards keep teams nimble, informed, and ahead of the curve.
How can businesses avoid overwhelming users with too much data?
It’s easy to fall into the trap of putting everything on one screen, but that just creates noise. The best dashboards keep it simple. Focus on the most important KPIs, use visuals that are easy to read, and let users interact with the data—like filtering or drilling down—only when they need more detail. Think of your dashboard like a car dashboard: you don’t need every engine stat, just the stuff that helps you drive. The same goes for your business.
Can dashboards really help with sustainability and ESG goals?
Absolutely. More and more companies are using dashboards to track and share their progress on things like energy use, emissions, waste reduction, and diversity. It helps keep ESG efforts visible and accountable—not just for leadership, but across the whole organization. And when you can see your progress in real time, it’s easier to make smarter, more responsible decisions day to day—not just once a year in a report.
Because business moves fast. Whether it’s a sudden spike in website traffic, a drop in inventory, or a shift in customer sentiment, having real-time data means you can act immediately. You’re not waiting for a weekly report—you’re seeing what’s happening right now. That kind of speed can make a big difference, especially when every minute counts. Real-time dashboards keep teams nimble, informed, and ahead of the curve.
It’s easy to fall into the trap of putting everything on one screen, but that just creates noise. The best dashboards keep it simple. Focus on the most important KPIs, use visuals that are easy to read, and let users interact with the data—like filtering or drilling down—only when they need more detail. Think of your dashboard like a car dashboard: you don’t need every engine stat, just the stuff that helps you drive. The same goes for your business.
Absolutely. More and more companies are using dashboards to track and share their progress on things like energy use, emissions, waste reduction, and diversity. It helps keep ESG efforts visible and accountable—not just for leadership, but across the whole organization. And when you can see your progress in real time, it’s easier to make smarter, more responsible decisions day to day—not just once a year in a report.


