Data Modeling & Processing
Unified KPI Model (QTopics-Compatible Semantic Layer)
ENGINE supported in developing a globally aligned KPI dictionary covering:
- MAU / WAU
- Feed deliveries
- Impressions
- Unique viewers
- Engagement rate
- CTR
- Dwell time
- Completion rate
- Content category performance
Although QTopics was not deployed in this phase, ENGINE:
- Ensured all metrics follow QTopics semantic conventions
- Prepared KPI logic to support AI-driven natural language queries
- Streamlined governance to reduce ambiguity
This future-proofed analytics for AI-enabled reporting.
MAU Framework
ENGINE implemented a standardized MAU calculation:
- Monthly Active Users by region
- Weekly-level activation patterns
- Multi-quarter trendlines
- Regional benchmarking
- Baseline comparisons for anomaly detection
Replacing prior inconsistent definitions increased reporting accuracy.
RFM-Style Engagement Segmentation Model
ENGINE created an RFM-based segmentation system to classify employees:
Segment | Definition | Purpose |
Champions | High-frequency engagers | Identify top content consumers |
Regulars | Moderate, steady activity | Expand engagement volume |
At-Risk | Engagement declining | Early intervention indicator |
Dormant | Very low/no activity | Platform or awareness issues |
New Users | Recently onboarded | Track onboarding effectiveness |
This enabled insights beyond aggregate metrics.
RFM Heatmap

- Sketch Example of the RFM used for the project
MBR/QBR Reporting Automation
ENGINE automated:
- Quarterly KPI rollups
- Multi-region comparisons
- MAU & engagement shifts
- Top/Bottom content insights
- Executive summary KPIs
This removed hours of manual slide creation.
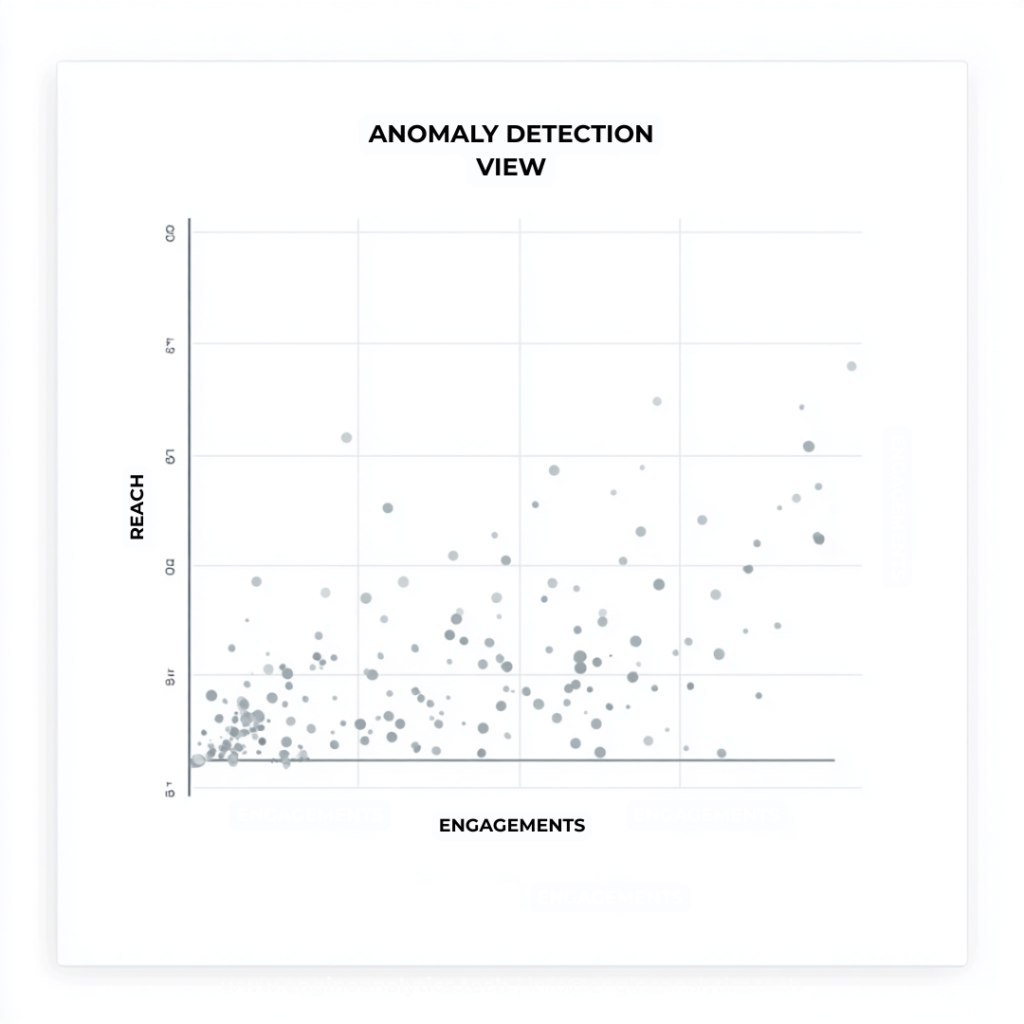
Anomaly Detection Engine
Detects:
- Drops or spikes in engagements
- Underperforming content clusters
- Regional divergence
- Platform outages reflected in behaviour
- Misconfigurations causing reach issues
DataOps & Pipeline Optimization
- Standardized Athena models
- Removed redundant data flows
- Increased query efficiency for QuickSight
- Documented full data lineage
- Reduced BI engineering workload significantly
Results & Analysis
Key Insights Delivered
- Clear MAU trends across the global region department
- Identification of high-performing content categories
- Visibility into content fatigue
- RFM segmentation showing shifts in employee engagement
- KPI alignment across regions
- Faster insights for leadership via automated MBR/QBR dashboards
- Early detection of abnormal usage patterns
Dashboards & Visualizations Delivered
- MAU/WAU Trend Dashboard
- RFM Engagement Heatmap
- Content Engagement Heatmap
- CTR and Engagements Trend Analysis
- Top/Bottom Articles
- Regional Performance Comparison
- Anomaly Detection Alerts
- MBR/QBR Leadership Summary
All dashboards refresh automatically on a daily basis without manual effort.
Implementation & Impact
Applications
The automated system now supports:
- Weekly comms operations
- Leadership-level reporting
- Quarterly business reviews
- Cross-region content optimization
- Engagement strategy refinement
- Platform health monitoring
- AI-ready data governance
Impact
- 30–50% reduction in BI and comms reporting workload
- Zero manual MBR/QBR reporting
- Higher content effectiveness across regions
- Better decision-making driven by segmented insights
- Improved internal KPI alignment
- Semantics Layer in place for future AI-powered reporting (QTopics)
- Scalable model ready for Global rollout