
Table of Contents
Paid Media Reporting Dashboard Project Overview
Background
A boutique paid media agency based in New York faced significant challenges with their performance reporting system. Like many in the industry, they relied on numerous spreadsheets, manually downloaded from various platforms. This outdated process involved daily data pivoting, consuming countless hours or even days in collecting, organizing, cleaning, and analyzing performance marketing data.
Recognizing the inefficiency and potential for error, we at ENGINE offered a transformative solution: an automated, centralized system featuring an interactive paid media reporting dashboard. This innovation streamlined their entire reporting process, enabling quick access to real-time data and insights.
Objectives
- Enhance Efficiency and Reduce Time Wastage
- Improve Data Accuracy and Reliability
- Enhance Decision-Making with Real-Time Insights
Tech Stack
The technologies used in this project were the following:
- Google Ads & Facebook Ads APIs
The paid media sources APIs to which we applied rigourous taxonomy and naming convention logics for better reporting. - Fivetran
A robust EL (Extraction & Loading) tool used to automated the daily extraction of the data from Paid Media platforms to the data-warehouse. - Google Cloud Platform
A cloud system for enhanced storage capabilities and automation features. - Cloud Functions
We leveraged CF to send alerts about data quality issues and delays happening in the flows. - Google BigQuery
A data warehouse used for storing and processing data. - Looker
A tool for data visualization, highlighting trends and patterns
Data Collection and Processing
Data Sources
The project utilized APIs from major paid media platforms like Google Ads and Facebook Ads. By implementing rigorous taxonomy and naming conventions, the project ensured consistency and precision in data extraction. This foundational step was critical in enabling seamless data integration and reporting.
Data Processing
Using Fivetran, an advanced EL (Extraction and Loading) tool, the project automated the daily extraction of data from the paid media platforms directly into the data warehouse. This automation minimized the manual effort required and reduced the risk of data entry errors, aligning with the objective of improving data accuracy and reliability.
The extracted data was stored in Google BigQuery, a powerful data warehouse that facilitates large-scale data storage and complex querying. Google Cloud Platform’s robust infrastructure supported this by offering scalable storage capabilities and enhanced automation features.
Cloud Functions were leveraged to monitor the data flows continuously. These functions triggered alerts for any data quality issues or delays, ensuring that any potential problems could be addressed promptly. This proactive approach helped maintain the integrity and reliability of the data processing system.
Finally, Looker was employed as the tool for data visualization. It allowed users to easily interpret trends and patterns through dynamic dashboards and reports. This tool made the data not only accessible but also actionable, empowering users to make informed decisions quickly based on real-time insights.
Results and Analysis
Findings
The centralized dashboard facilitated a deeper understanding of campaign performance across multiple platforms. Key findings included:
- Efficiency Gains: Automation reduced the data processing time by over 50%, allowing analysts to dedicate more time to strategic activities rather than data management.
- Increased Data Accuracy: The integration of rigorous taxonomy and naming conventions significantly lowered the incidence of data discrepancies, ensuring that reports were based on reliable and accurate data.
- Enhanced Responsiveness: Real-time data access enabled quicker responses to market changes, improving the agility of campaign adjustments and optimization efforts.
Visualizations
To effectively communicate the complex data and trends, the dashboard incorporated various advanced visualizations:
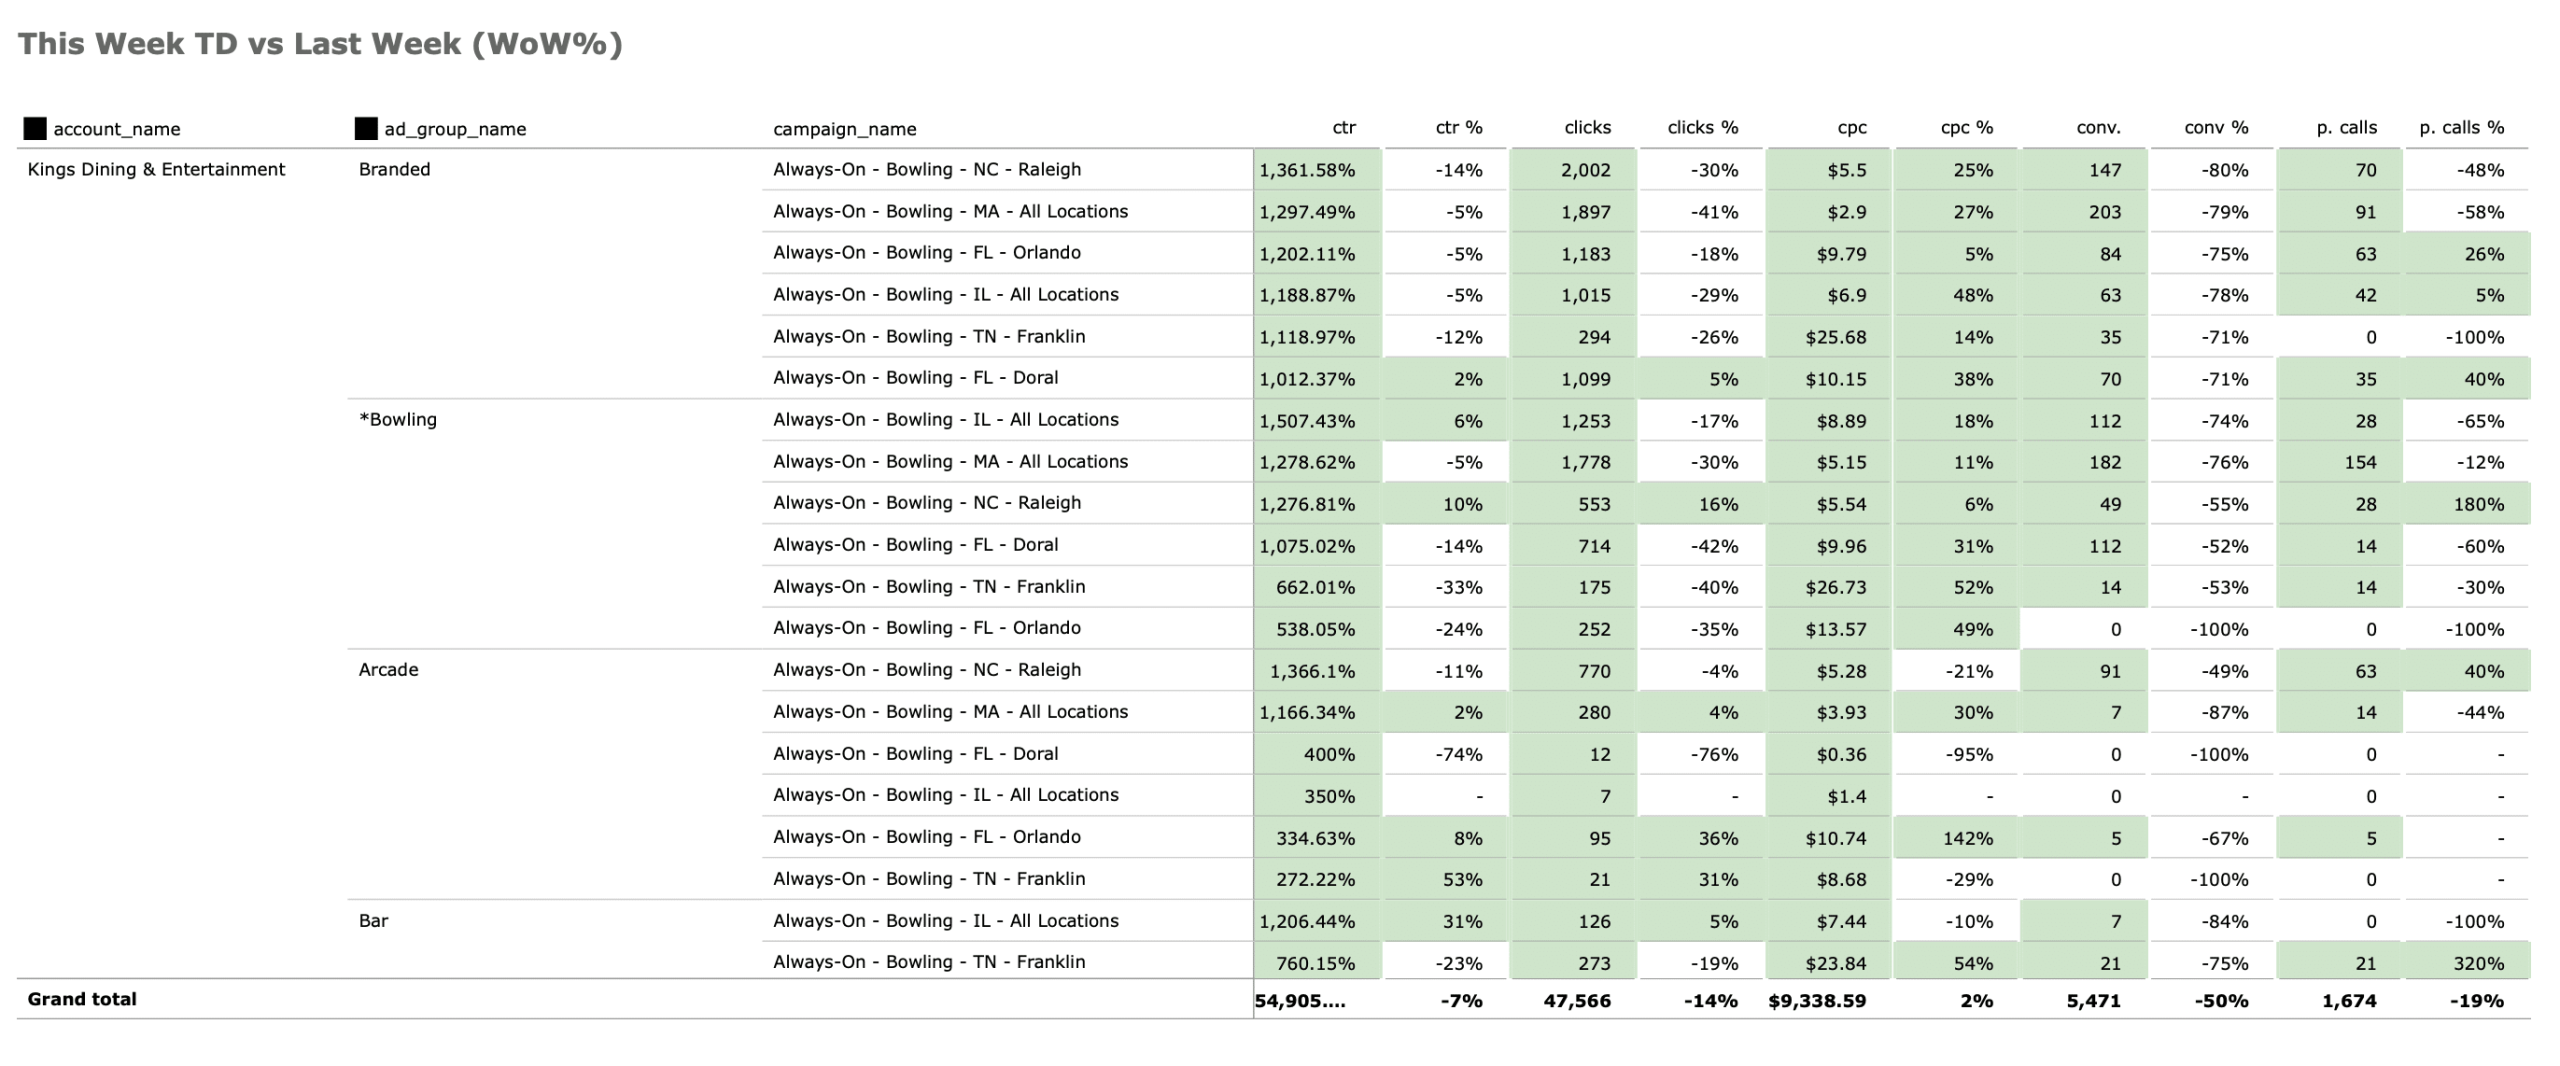
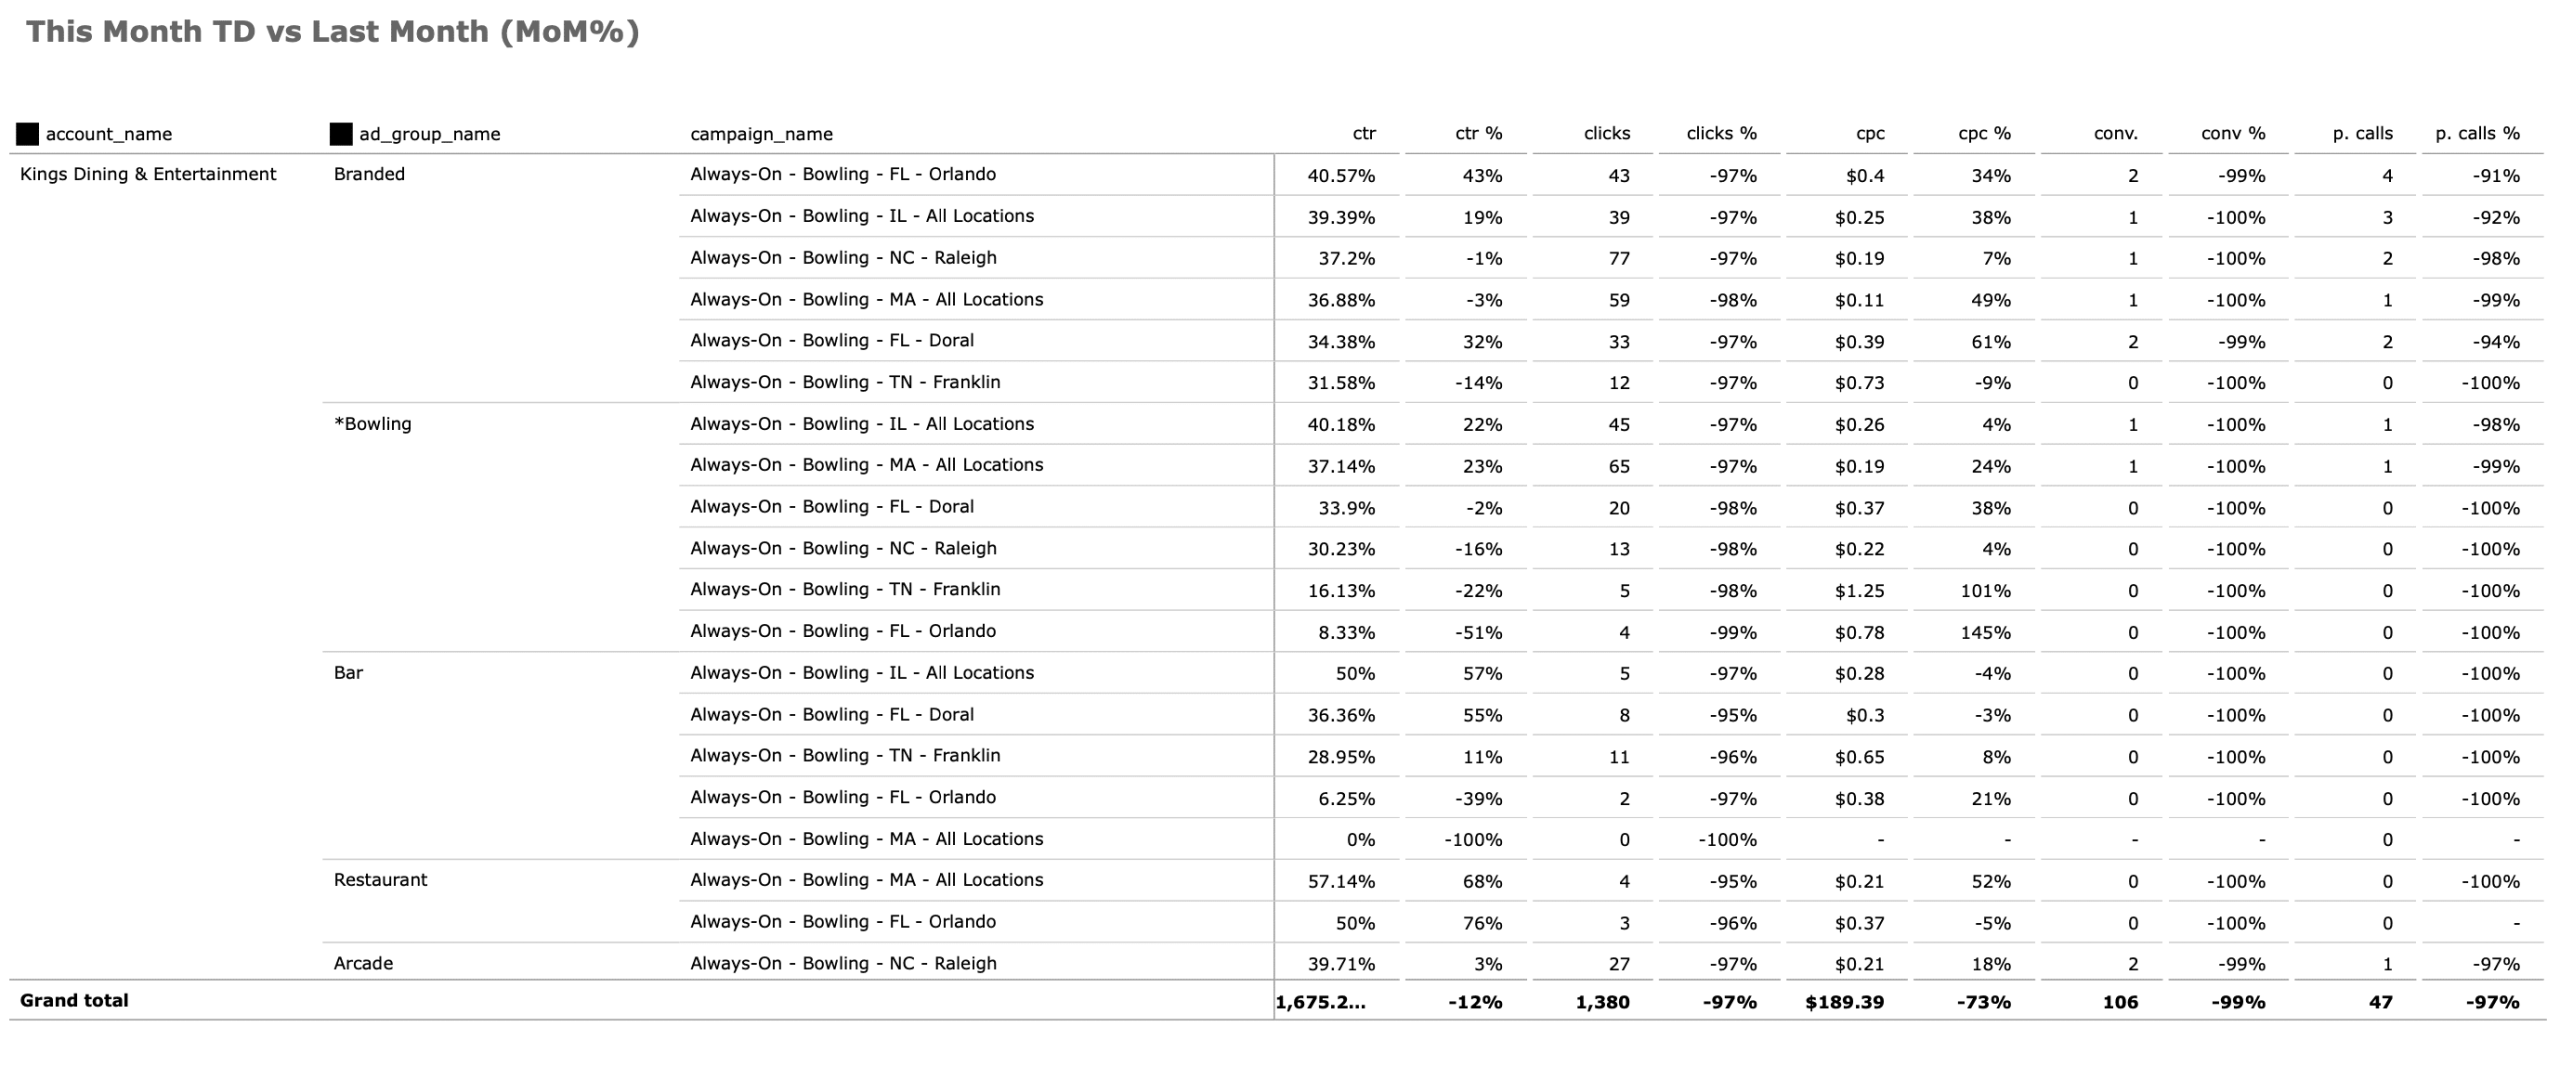
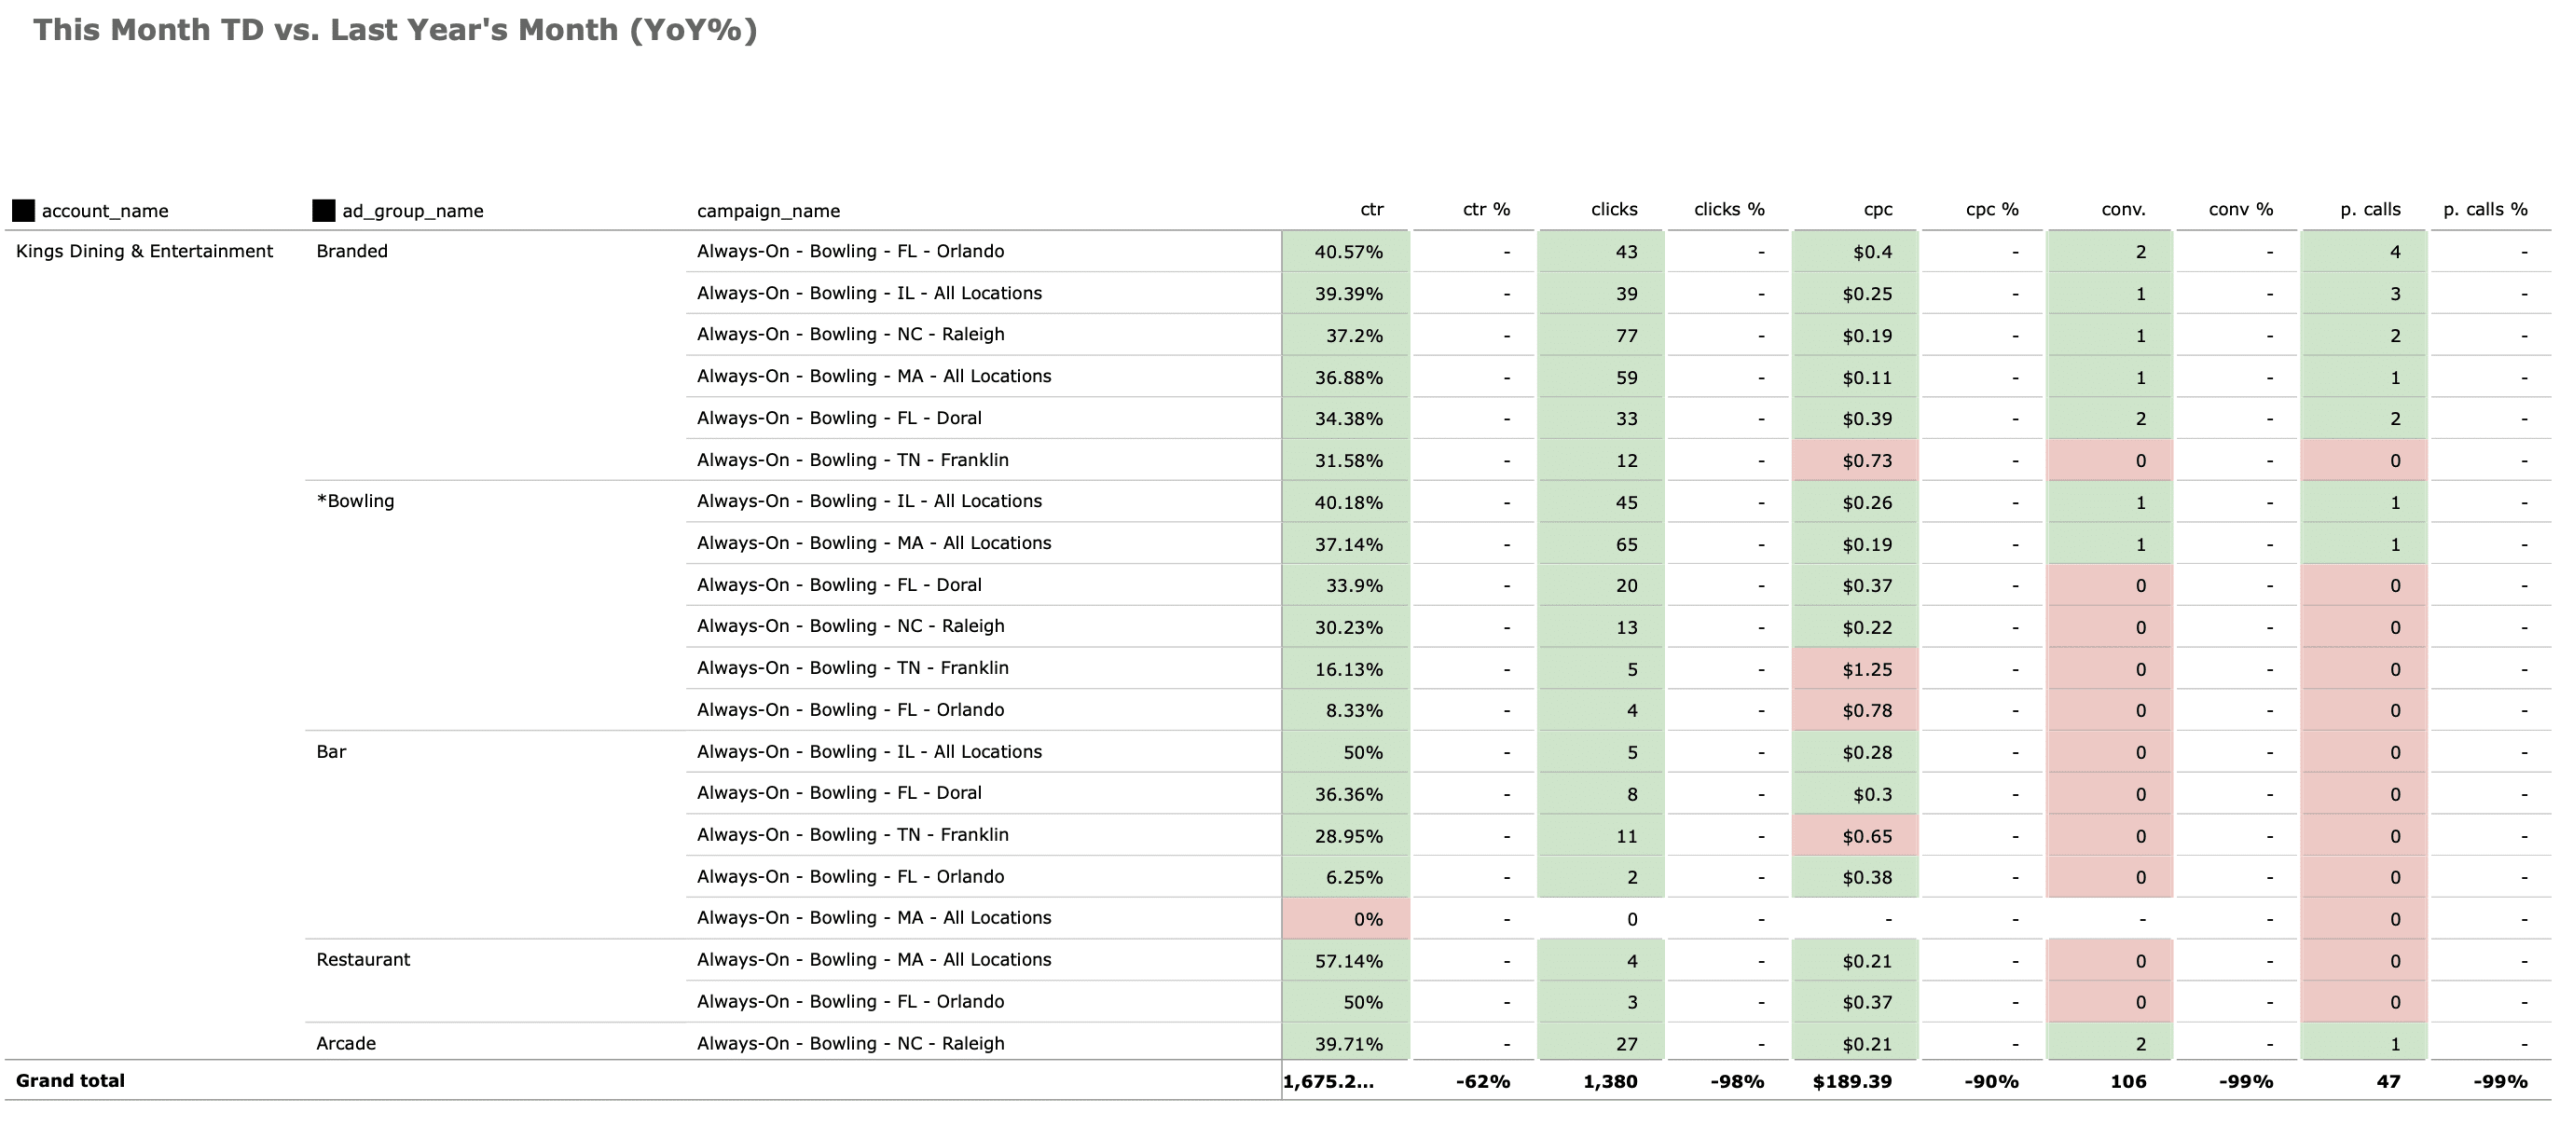
- Dynamic Reporting Tables: We created week-on-week, month-on-month, and year-on-year comparison tables, which were instrumental in conducting percentage analyses. These tables allowed for easy visualization of trends over different time frames, helping identify patterns that might not be visible on a daily or monthly basis.
- Interactive Charts and Graphs: The dashboard included a range of interactive elements, such as line graphs, bar charts, and heat maps, each tailored to showcase specific metrics like click-through rates, conversion rates, and cost per acquisition.
- Customizable Filters: Users could customize views and filters according to specific criteria such as time periods, campaigns, or demographic segments, making it easier to drill down into the data for detailed analysis.
These visualizations not only enhanced the user experience but also empowered the team to make informed, data-driven decisions swiftly. The ability to analyze performance across different time scales with percentage analysis tables provided a comprehensive view of growth trends and campaign effectiveness over time. This analytical capability proved crucial in refining marketing strategies and optimizing return on investment.
Week on Week (WoW) Table
Month on Month (MoM) Table
Year on Year (YoY) Table
Implementation and Impact of the Paid Media Reporting Dashboard
Applications
The dashboard was deployed with several key applications designed to streamline operations and enhance decision-making:
- Real-Time Performance Monitoring: The dashboard provided continuous, real-time monitoring of all paid media campaigns, enabling immediate identification of trends and deviations.
- Campaign Optimization: By leveraging the integrated data from Google Ads, Facebook Ads, and other sources, the dashboard facilitated quick adjustments and optimizations based on performance metrics.
- Strategic Planning Support: The enhanced data visualization tools supported more sophisticated strategic planning by providing clear insights into campaign effectiveness across various dimensions.
Outcomes
- Reduced Time on Data-Related Tasks: With the automation of data collection, extraction, and processing, the agency experienced a drastic reduction in the time spent on data-related tasks. This shift freed up valuable resources, allowing staff to divert their attention from routine data handling to more value-added activities.
- Enhanced Strategic Focus: Less time spent on data management meant more time available for strategy development and performance improvement. The team could now focus on analyzing data for insights rather than compiling it, leading to more effective campaign strategies and better alignment with business objectives.
- Improved Decision-Making Efficiency: The real-time data access and sophisticated visualization tools enabled faster and more informed decision-making. This responsiveness not only improved campaign performance but also enhanced the agency’s ability to adapt to market changes swiftly.
Overall, the implementation of the paid media reporting dashboard significantly transformed the agency’s approach to data and campaign management. By automating the tedious aspects of data handling and enhancing the analytical capabilities, the agency not only saved time but also improved its strategic engagements, leading to more effective and efficient marketing operations.
Frequently Asked Questions (FAQs)
What is a paid media reporting dashboard?
A paid media reporting dashboard is a digital tool that aggregates data from various paid advertising platforms into a single interface. It allows for real-time monitoring and analysis of campaign performance across different channels, facilitating better decision-making and strategy optimization.
How does the dashboard integrate with existing digital marketing tools?
The dashboard seamlessly integrates with popular digital marketing platforms such as Google Ads and Facebook Ads through APIs. This integration ensures that all campaign data is automatically pulled into the dashboard, eliminating the need for manual data entry and reducing the risk of errors.
What types of visualizations can be expected from the dashboard?
The dashboard offers a variety of visualization options including line charts, bar graphs, heat maps, and customizable tables for time comparisons like week-on-week, month-on-month, and year-on-year analyses. These visualizations help in clearly understanding trends, comparing performance metrics, and making data-driven decisions.
Can the dashboard be customized to fit specific business needs?
Yes, the dashboard is highly customizable. Users can adjust settings to display specific data points, filter results based on certain criteria, and even tailor the dashboard’s layout to better fit their business requirements and preferences.
What measures are in place to ensure data security and privacy?
We prioritize data security and privacy by employing robust security measures including data encryption, secure data storage solutions, and compliance with all relevant data protection regulations. Our platform is built on secure infrastructure with regular security audits to ensure that your data is protected at all times.
How does the dashboard handle large volumes of data?
The dashboard is built on powerful data processing technologies such as Google BigQuery, which supports the storage and analysis of large datasets. This ensures that even with substantial amounts of data, the dashboard remains fast and responsive.
What kind of support and training do you offer for new users?
We provide comprehensive support and training for all new users, including onboarding sessions, detailed user manuals, and ongoing technical support. Our goal is to ensure that you are fully equipped to utilize all the features of the dashboard effectively.
How often is the data updated in the dashboard?
The data in the dashboard is updated in real-time, ensuring that you always have access to the most current information. This enables immediate insights into campaign performance and the ability to react quickly to market changes.
What is the setup cost for this type of paid media reporting dashboard?
The setup cost for the paid media reporting dashboard can vary depending on several factors, including the complexity of your existing systems, the specific customizations required, and the scale of your operations. It usually ranges between $5,000 to $15,000 depending on several factors.
We offer a scalable pricing model that is designed to provide flexibility and ensure you only pay for what you need. To get a detailed quote tailored to your business requirements, please contact our sales team, and we will be happy to provide you with a personalized estimation.
Why Partner with a Data Analytics Company like ENGINE
ENGINE’s team comprises experienced marketing analysts, data scientists, and engineers. We create world-class, customizable, custom-made customs for companies of all sizes. We only use trusted platforms such as; Fivetran, DBT, and Tableau for our data extraction, transformation, and visualization. Contact us to know more about out tech stack!
Our wide range of business intelligence dashboards is hugely dependent on machine learning technologies. This enables our solutions to provide accurate, up-to-date information.
Are you looking to centralize your data and create awesome kick-ass business dashboards to track performance?
Click the button to get in touch with out Team!